


Mexican Peso Talking Points:
- It was a topsy-turvy year of 2020 for USD/MXN, which rallied by as much as 39.09% only to then fall by as much as 23.58%.
- With the wide-expectation for the ‘everything rally’ to continue, will EM currencies such as the Mexican Peso get another shot-in-the-arm, helped along by USD-weakness?
- The analysis contained in article relies on price action and chart formations. To learn more about price action or chart patterns, check out our DailyFX Education section.
We’re now in 2021, where the expectation for the ‘everything rally’ to continue appears to be a widely-held consensus. And while the phrase ‘it’s different this time’ is riddled with danger, there are a number of unique/peculiar items in the backdrop that can substantiate an argument for continued strength across risk assets, including emerging market currencies like the Mexican Peso.
Volatility was on full display in USD/MXN during 2020, in both directions. As the coronavirus pandemic was getting priced-in to global markets last February, with USD-strength dominating, USD/MXN put in a meteoric rise of more than 39% from the February low up to the April high. This was an all-time-high for the pair; but much of that move was soon to be eradicated as a potent combination of calm and USD-weakness took over for the final eight months of 2020 trade. This allowed for USD/MXN to fall by as much as 23.58% from the April high down to the December low.

USD/MXN Daily Price Chart
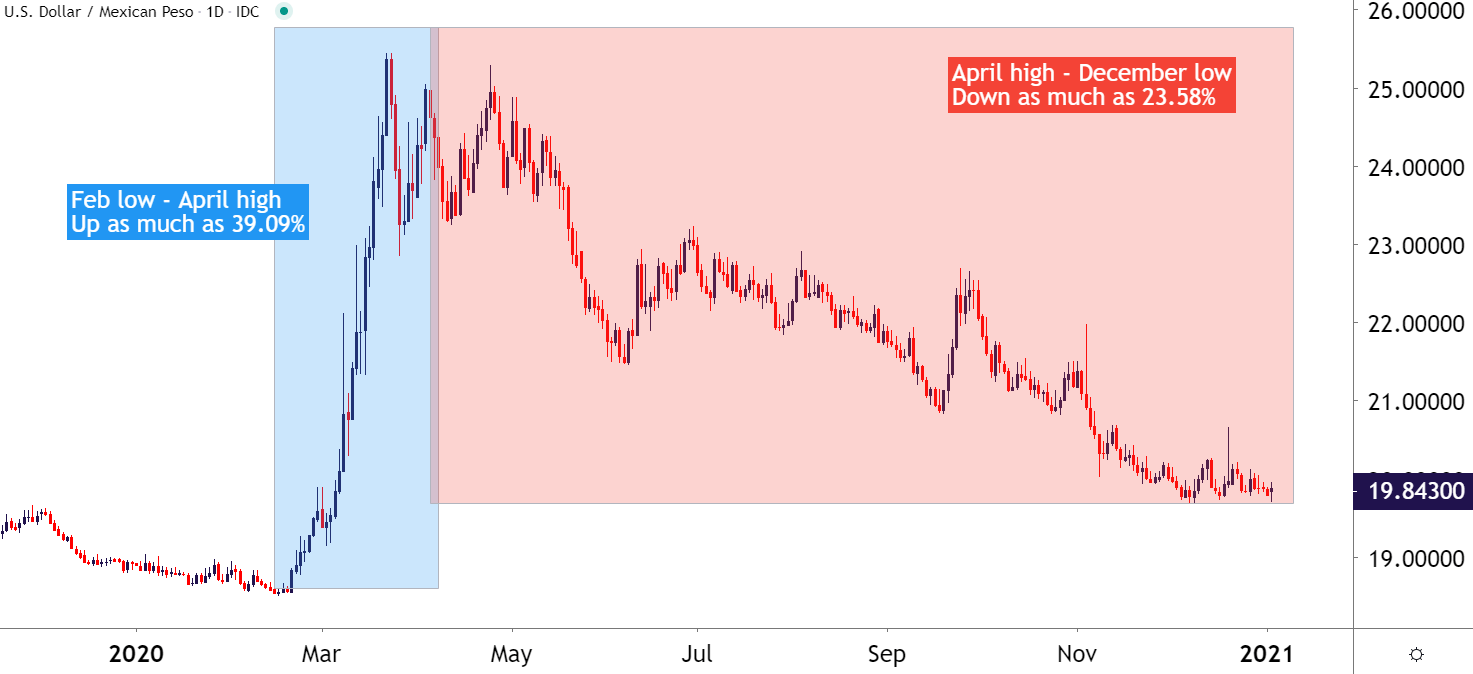
Chart prepared by James Stanley; USD/MXN on Tradingview
USD/MXN Sell-Off Stalls in December
Sellers haven’t yet had much run below the 20.00 handle in USD/MXN. The psychological level came back into play in early-November, and despite a few different fits and starts, sellers haven’t been able to really drive in that fresh new down-trend of lower-lows and lower-highs.
Instead, we’ve seen a bit of stubborn support develop around the 19.70 level, with multiple failures to breakdown through this price. This led into a rather outsized spike on December 21st but, since then, this support has appeared to carry a diminishing marginal quality as lower-highs have printed on shorter-term charts over the past couple of weeks.
This can keep the door open for short-term breakdown potential; although the bigger picture look may be a bit more daunting on that front, which we’ll address below.
USD/MXN Four-Hour Price Chart
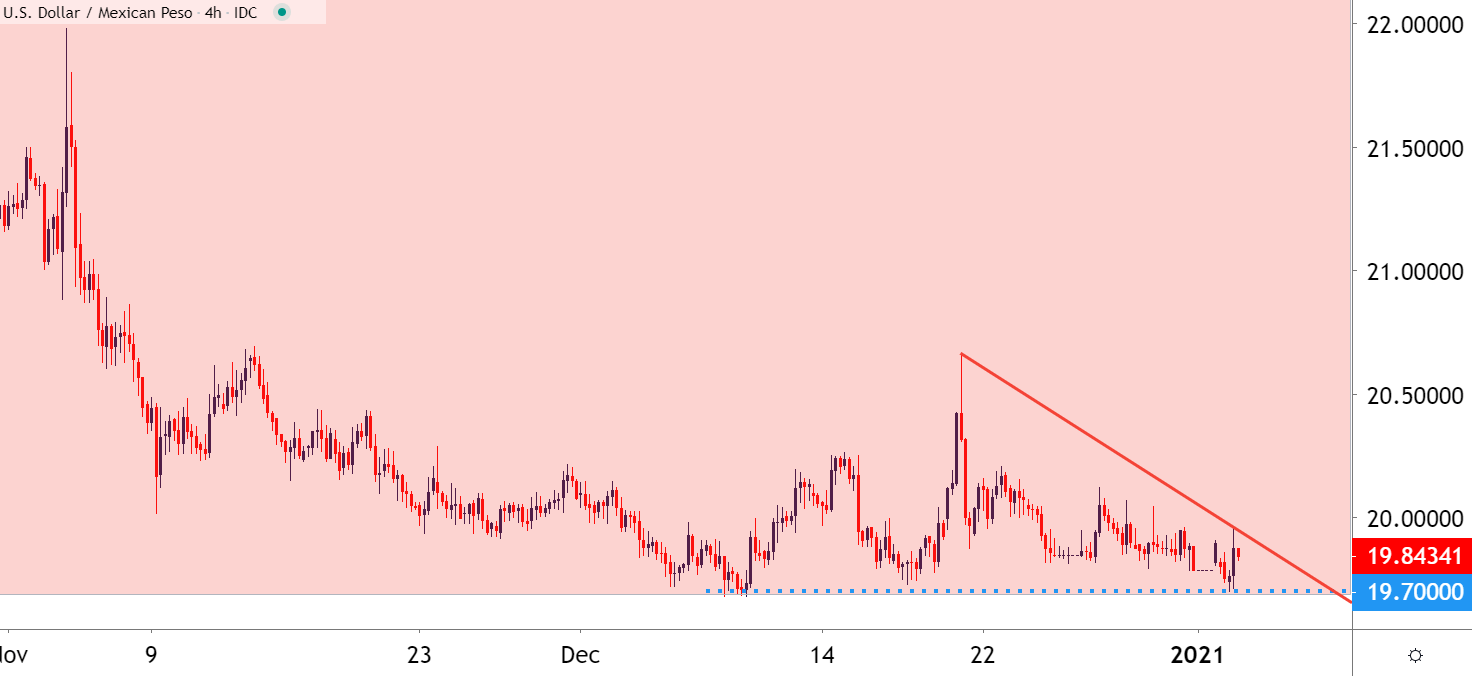
Chart prepared by James Stanley; USD/MXN on Tradingview
Taking a step back to the weekly chart and this is where USD/MXN bulls may have some room to operate. Combining the lack of motivation from bears below the 20.00 psychological level, along with the build of a falling wedge formation, highlights the potential for a pullback scenario in USD/MXN. This wouldn’t necessarily have to eliminate the dominant downtrend, but the formation could, however, prelude a pullback scenario that could re-open the door for longer-term bearish strategies in the pair.
Falling wedges can be especially interesting for bullish reversals – to learn more, check out our article on the topic in DailyFX Education.
USD/MXN Weekly Price Chart
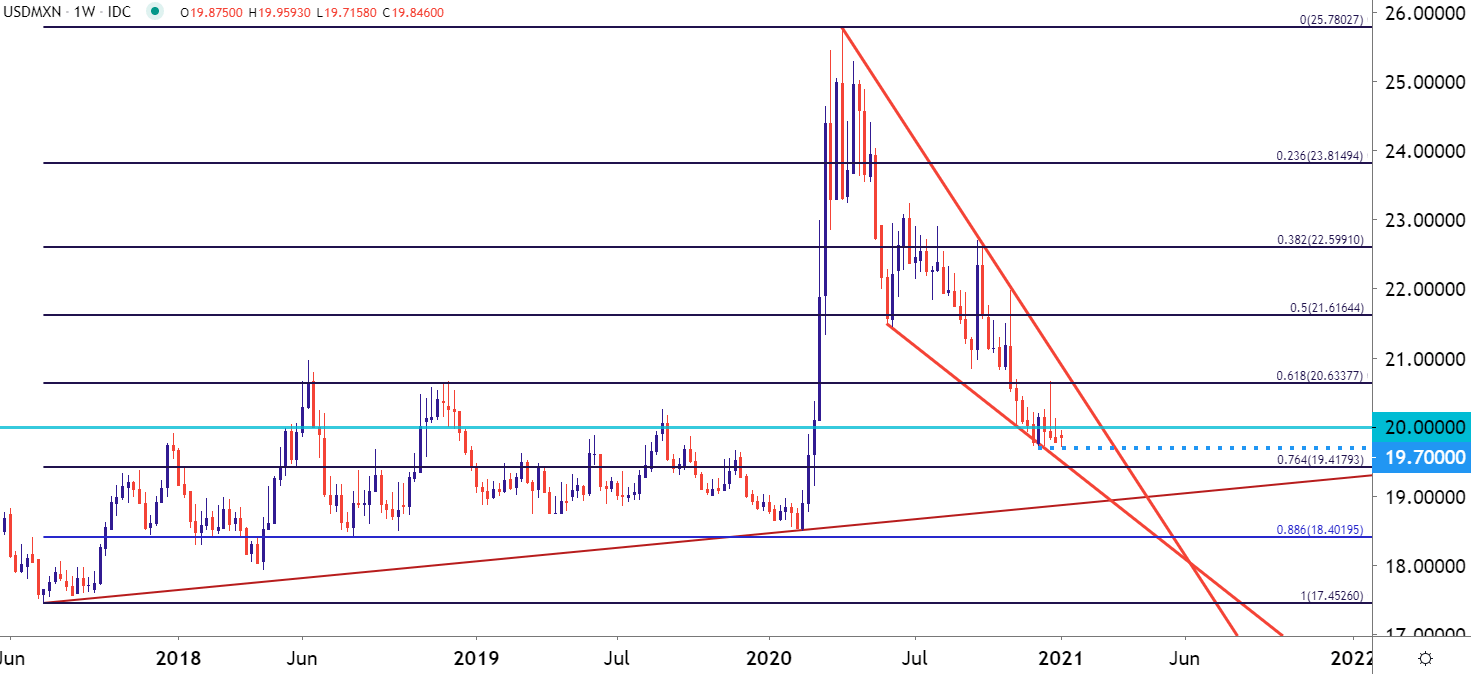
Chart prepared by James Stanley; USD/MXN on Tradingview
USD/MXN Levels
As noted earlier, current support is showing at a big spot on the chart, around the 19.70 spot that’s proven to be fairly stubborn so far. But – if bears do pose a breakdown, the next big item of obvious support is down around 19.42, as this is the 76.4% retracement of the 2017-2020 major move. Below that – the 2020 low lurks around 18.50.
On the resistance side of the coin – sellers may be able to look for some lower-high resistance on a test of the psychological 20.00 handle. Above that, 20.64 helps to mark the December high and is also very near the 61.8% Fibonacci retracement of the same 2017-2020 major move. Above that is a prior batch of swing lows, plotted around 20.85, after which the 21.62 level comes into view.
USD/MXN Daily Price Chart
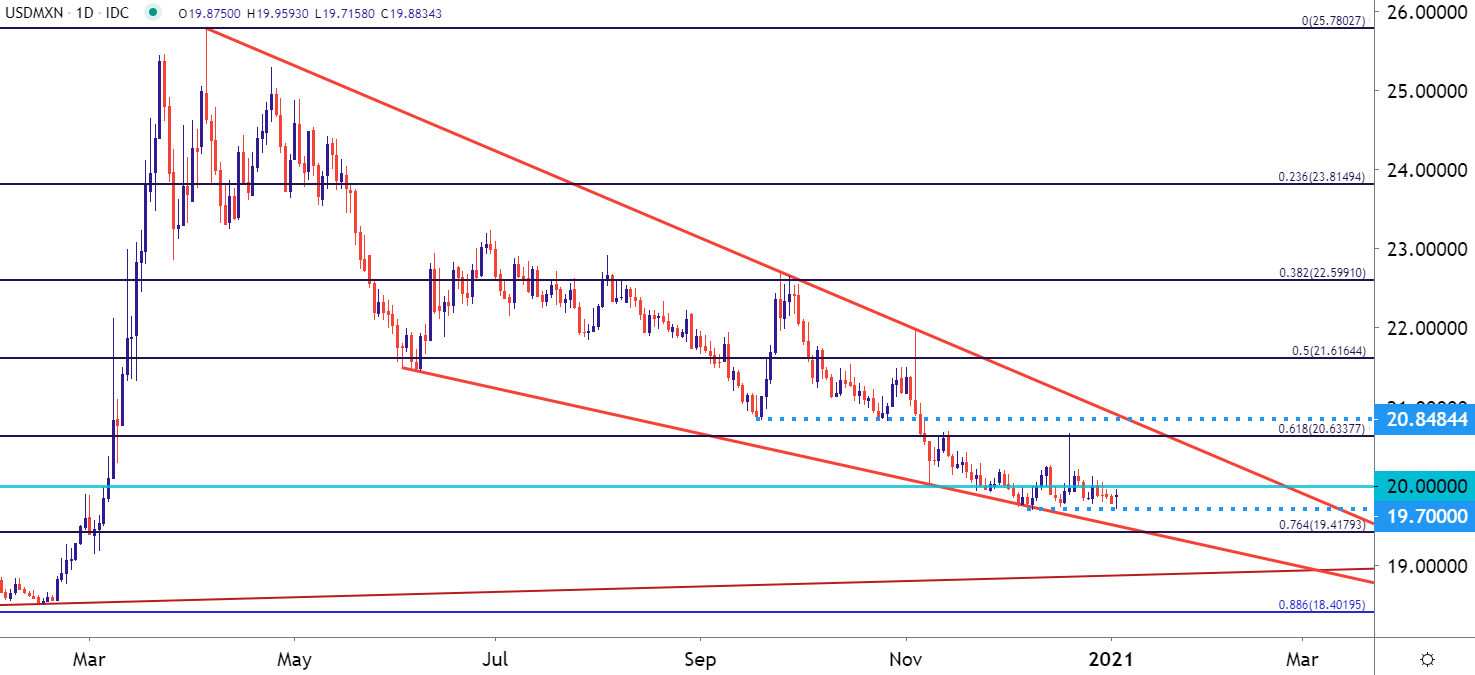
Chart prepared by James Stanley; USD/MXN on Tradingview
--- Written by James Stanley, Strategist for DailyFX.com
Contact and follow James on Twitter: @JStanleyFX


