


NASDAQ 100, NIKKEI 225, ASX 200 index Technical Forecast: BULLISH
- The Nasdaq 100 index breached key chart resistance and aims for higher levels into 2021
- Japan’s Nikkei 225 hit a three-decade high in November 2020, eyeing key chart resistance
- Australia’s ASX 200 index tracking higher in an “Ascending Channel” as metal prices surge
A relentless rally on Wall Street appears to be carrying on, propelled by an impending US fiscal stimulus package, vaccine rollout and the Federal Reserve’s dovish stance in the wake of coronavirus resurgence in the world’s largest consumer market. All three major US indices marched to their record highs in December, which some traders describe as a “Santa rally”. Their ascending trends appear to remain intact from a technical perspective, albeit some sporadic pullbacks might still be seen. Download DailyFX’s quarterly equity trading guild at the end of this article to read more.
Nasdaq 100 Index Technical Analysis:
The Nasdaq 100 index broke above a key chart resistance level at 12,300 in December 2020 and has since opened the door for further upside potential with an eye on 13,000. The trend remains bullish-biased as the index forms consecutive higher highs and lows since rebounding from its March trough.
Looking ahead, the upward trajectory remains intact for the US stock market, albeit some technical pullbacks are possible into the first quarter of 2021. President-elect Joe Biden may bring major changes to US foreign policy alongside tax reforms after the January inauguration. Aside from that, the lingering impact of the Covid-19 pandemic, an uneven rollout of vaccines around the globe and the ongoing US-China spat are among the key event risks.
The Nasdaq 100 index registered a whopping 90% gain from March through to Dec 2020, reflecting strong upward momentum. On the weekly chart, the ascending trend showed no sign of stopping soon after prices broke above the 200% Fibonacci extension level at 12,280. Still, traders might need to be vigilant about short-term pullbacks should profit taking kick in.
Nasdaq 100 Index – Weekly Chart

Nikkei 225 Index Technical Analysis:
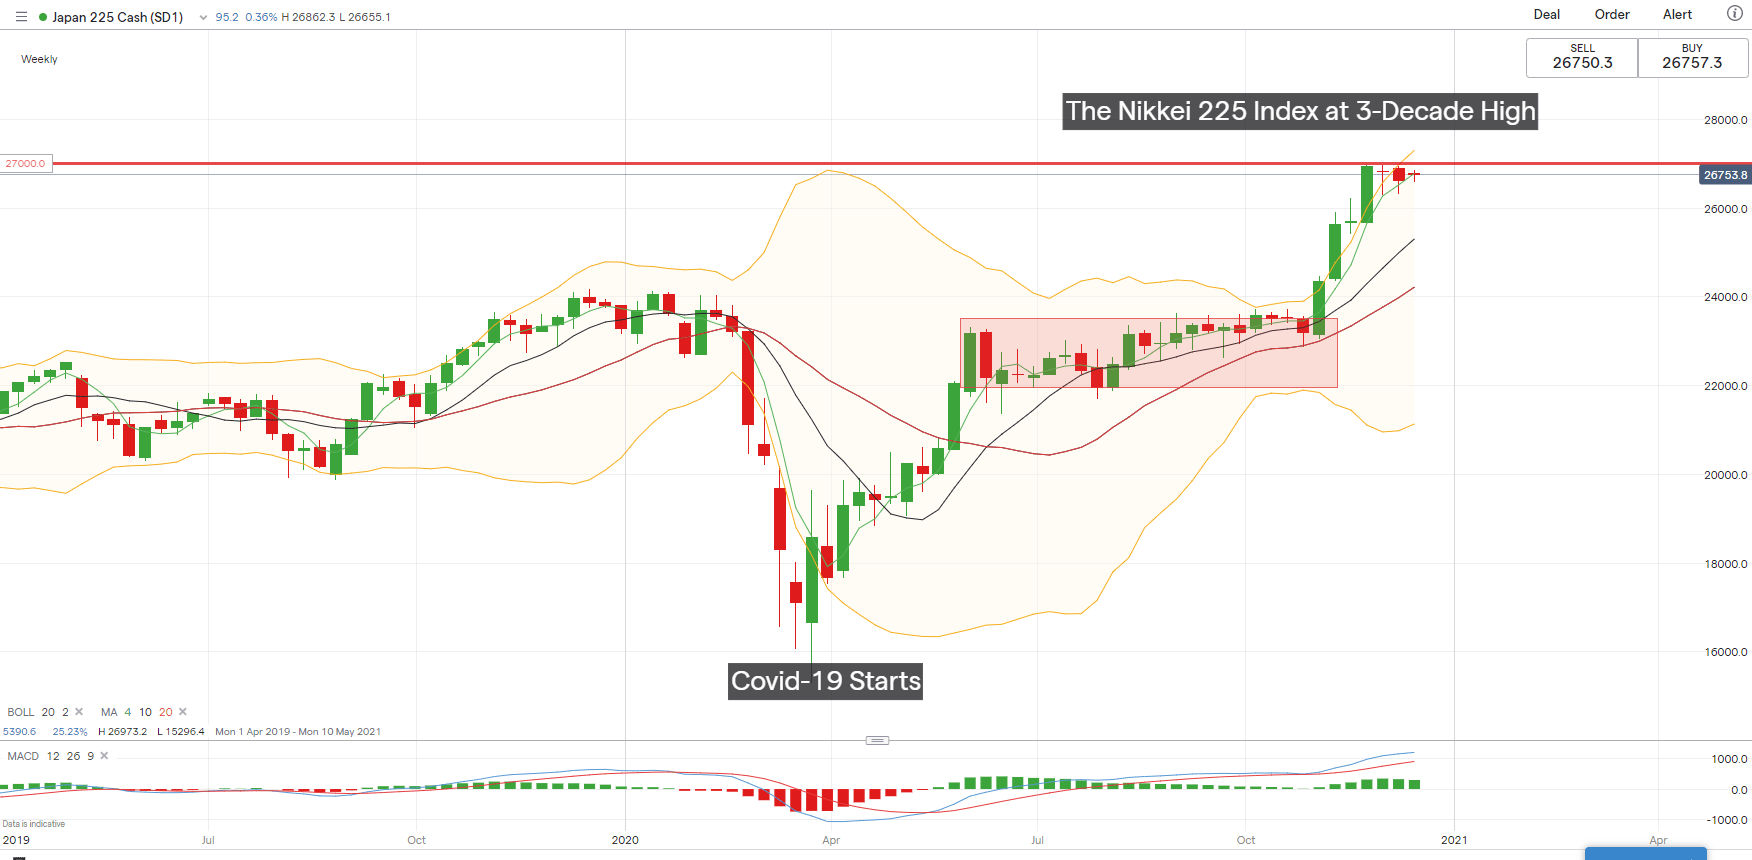
The Nikkei 225 index appeared to enter a brief consolidative phase in December after hitting a three-decade high at 26,970. This temporary pullback may not derail its upward trajectory, as suggested by the rising 4-, 10- and 20-week SMAs. Breaching a key chart resistance at 27,000 may open the door for more upside potential, whereas a deeper pullback from here may lead to a test of the 10-week SMA line.
Looking ahead, current consolidation may pave the way for higher highs should the rollout of Covid vaccines foster a faster pace of economic normalization.
Nikkei 225 Chart – Weekly Timeframe (2019 to 2020)
ASX 200 Index Technical Analysis:
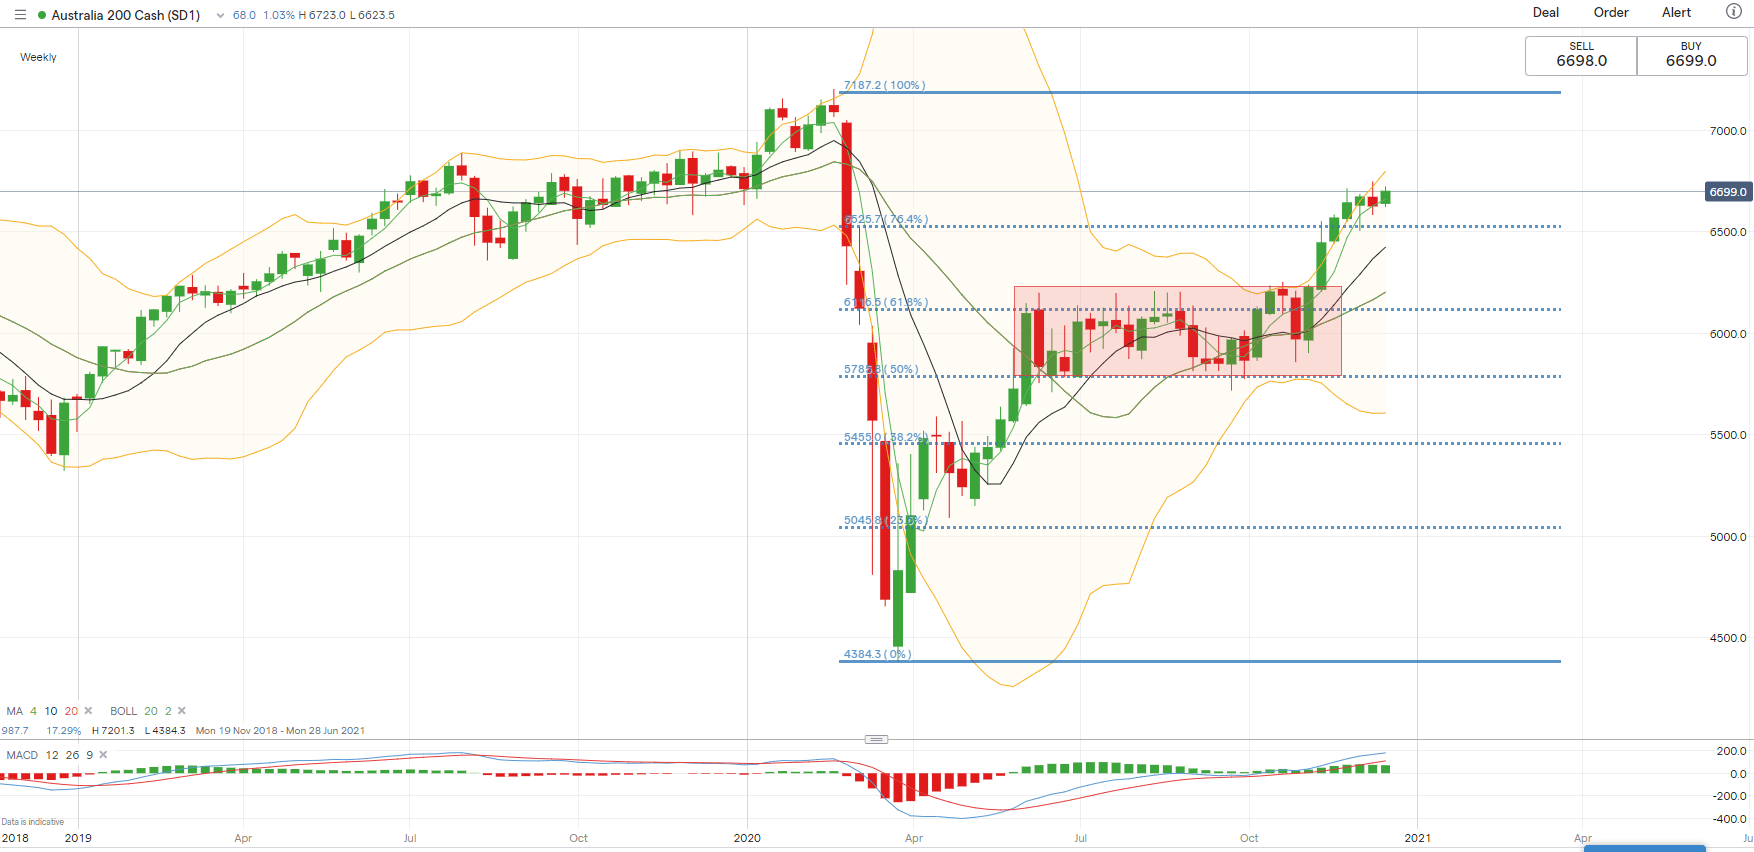
Australia’s ASX 200 Index appears to be on its way back to pre-Covid highs, with an immediate resistance level found at 6,700. The index consolidated from June to October 2020 before firmly breaking above the ceiling of the prevailing range (highlighted below), thanks to US election results, vaccine developments and soaring industrial metal prices.
Looking ahead, the upward trajectory for the ASX 200 remains intact as suggested by the ascending 4-, 10- and 20-week SMAs. Bollinger Band width is widening on the weekly chart, reflecting strong bullish momentum in the medium term. A firm breakout above the 6,700 resistance level may pave the way for further upside potential, with an eye on the all-time high of 7,200.
ASX 200 Index – Weekly Timeframe (2019 to 2020)

--- Written by Margaret Yang, Strategist for DailyFX.com
To contact Margaret, use the Comments section below or @margaretyjy on Twitter


