


US Dollar Q1 2021 Talking Points:
- Despite risk markets rallying aggressively in 2020, it was a bad year for USD bulls.
- The US Dollar just began to interact with the psychological level of 90.00 on the heels of the final FOMC rate decision of 2020.
- The analysis contained in article relies on price action and/or chart formations. To learn more about price action or chart patterns, check out our DailyFX Education section.
Coming Soon! Download the NEW 1st Quarter Forecast Live on Monday on our Free Trading Guides Page !
In a year where sellers dominated the currency, it’s become increasingly difficult to expect anything different to happen. For Q1 of 2021, I’m looking for a continuation in the bearish backdrop that’s become so incredibly loud around the US Dollar. There are numerous fundamental reasons for it, as Mr. Kicklighter has highlighted in the Fundamentals portion of this forecast: But there’s a litany of technical reasons, as well, and that was on full display in the last eight months of 2020 trade.
Perhaps one of the more difficult parts of a continued bearish stance around the USD is just how aggressively that trend has already built-in. The US Dollar is oversold from a few different vantage points and, logically, there’s only so far that this can run. This theme of USD-weakness got another fresh shot in the arm after I had written the forecast (but before it was released) during the December FOMC rate decision when Chair Powell seemed even less interested in asset prices than he had in the past. This helped the USD to push down to yet another fresh two-year-low, eventually finding a bit of support at what was the first downside target for Q1, 2021. That support was furnished by the psychological level of 90.00, and this may be a theme to keep an eye on in USD next year for a few different reasons.
To learn more about psychological levels, join us in DailyFX Education
US Dollar Four-Hour Price Chart: Pain Chain post-Election Runs into 90 Psych Level
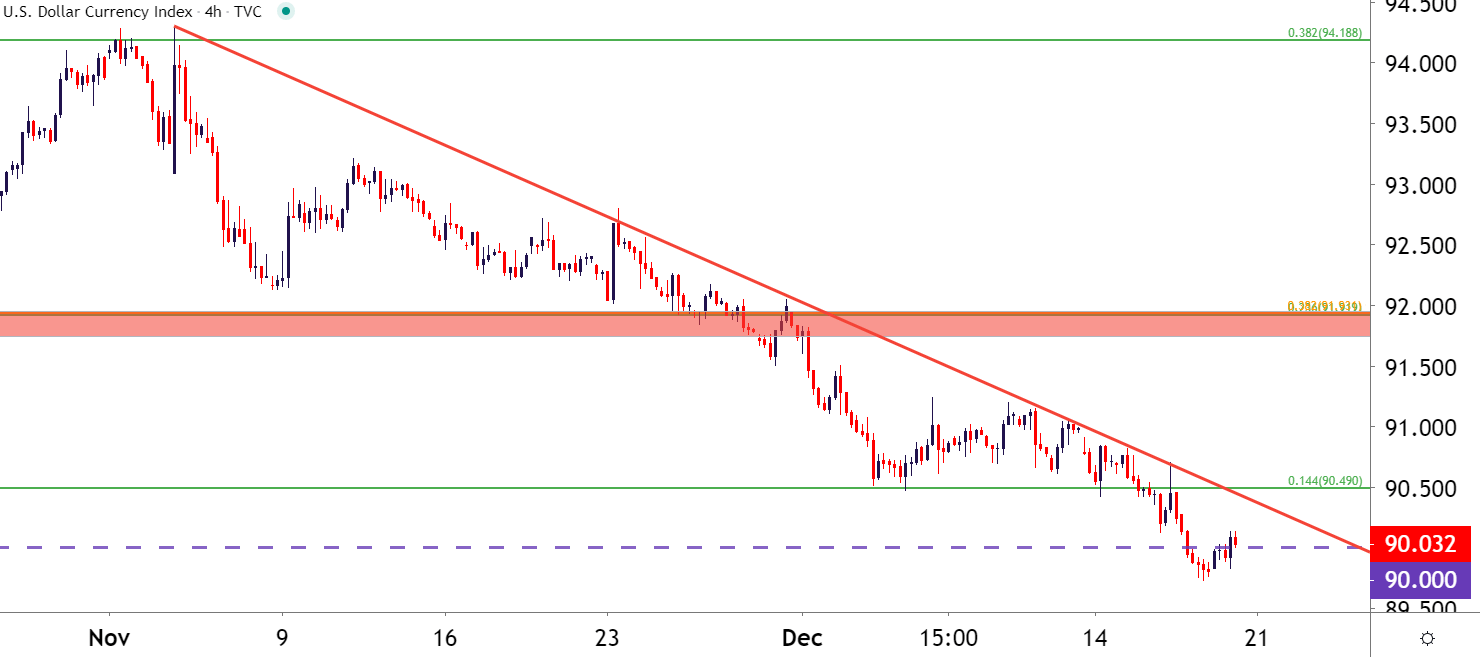
Chart prepared by James Stanley; USD, DXY on Tradingview
Of note with the end of the year looming – the US Dollar spent September-November building an evening star formation that, so far through December, has continued to show continuation potential. Evening stars can be interesting reversal formations because it’s a three-candle-sequence that can really allow for the ‘topping out’ aspect of a move to be very clear and apparent. Upon completion of such formations, traders will often look for continuation in the direction of the reversal; which, in the US Dollar, has thus far taken place as sellers have just continued to strike so far through December trade.
To learn more about Evening Star formations, join us in DailyFX Education
US Dollar Monthly Chart: Evening Star Builds September-November
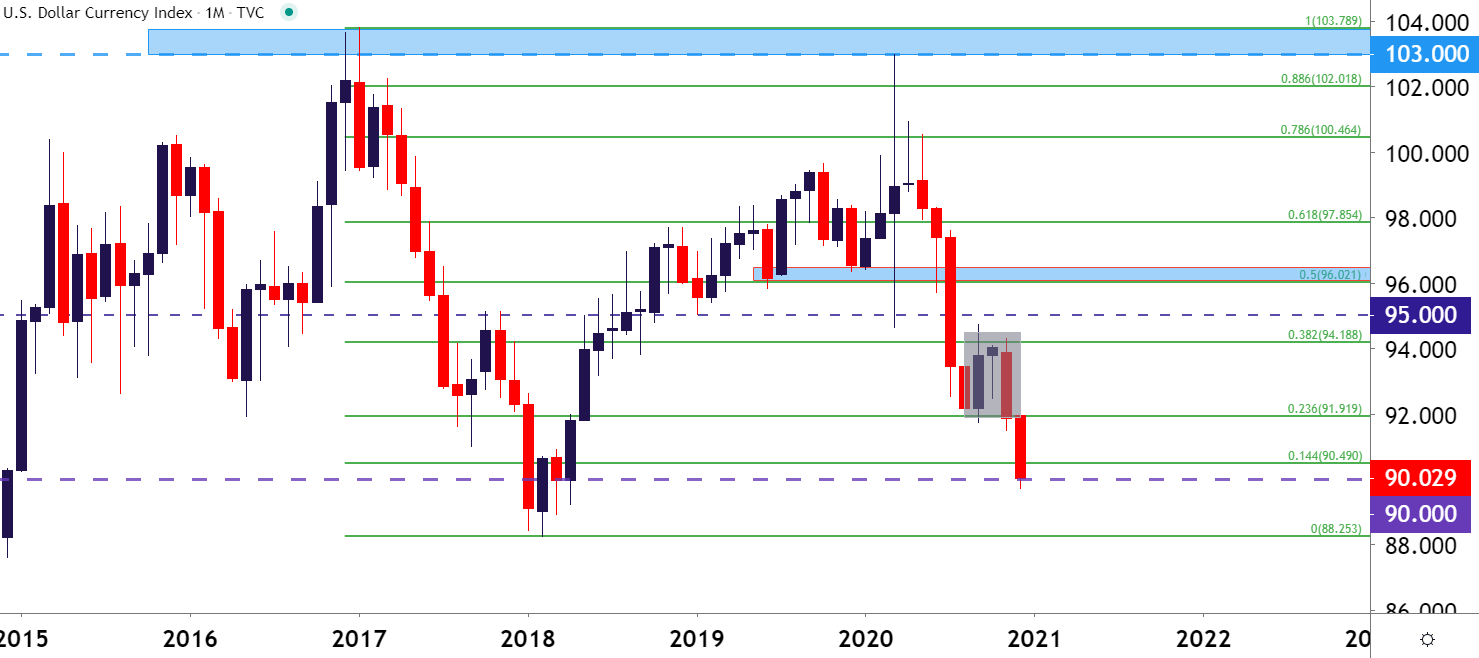
Chart prepared by James Stanley; USD, DXY on Tradingview
But – the critical zone of potential support still lurks below in USD. This is both a technical level as well as a prior point of importance for price action traders, and this will likely loom large as we open up next year if sellers are continuing to dominate the flow. If you want to find out what this level is, download the full report by clicking on the link below.

--- Written by James Stanley, Strategist for DailyFX.com
Contact and follow James on Twitter: @JStanleyFX


