


US Dollar Technical Price Outlook: DXY Weekly Trade Levels
- US Dollar technical trade level update – Weekly Chart
- USD marks fourth weekly reversal just above key confluence support
- DXY bears vulnerable while above 91.92- bearish invalidation steady at 94.65
The US Dollar is off more than 0.35% this week with an outside-weekly reversal in DXY taking the index back into multi-year uptrend support. The move marks the fourth consecutive weekly reversal in price as the index continues to range above this critical support zone. These are the updated technical targets and invalidation levels that matter on the US Dollar Index weekly price chart. Review my latest Strategy Webinar for an in-depth breakdown of this DXY technical setup and more.
US Dollar Index Price Chart – DXY Weekly
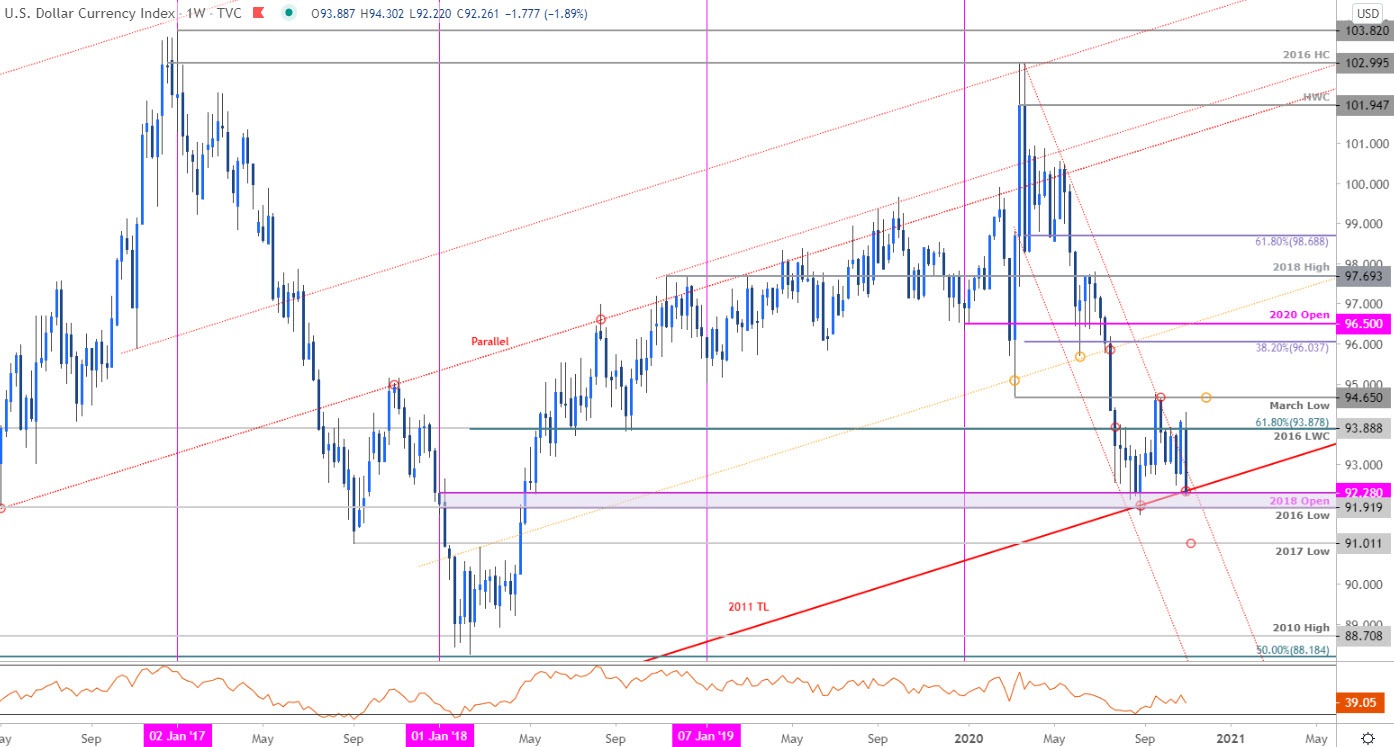
Chart Prepared by Michael Boutros, Technical Strategist; US Dollar Index on Tradingview
Notes: In out September US Dollar Weekly Price Outlook we noted that DXY was testing long-term slope support and to be on the lookout, “for downside exhaustion ahead of 92.28 IF price is heading higher with a close above 94.65 needed to fuel a larger recovery.” The rally pressed higher into the close of September with XAU/USD briefly registering a high at 94.74 before reversing sharply.
The decline is now once again testing a critical support zone at the 2011 trendline / 2018 yearly open at 92.28 with the 2016 swing low just beyond at 91.92 – looking for a major infection off this region in the days ahead. A break / weekly close below would be needed to suggest a larger trend reversal is underway with such a scenario eyeing initial support objective at the 2017 low at 91.01. Weekly resistance stands at the 61.8% Fibonacci retracement off the 2018 advance / 2016 low-week close at 93.88 with a breach above the March lows at 94.65 needed to invalidate the broader March downtrend.
For a complete breakdown of Michael’s trading strategy, review his Foundations of Technical Analysis series on Building a Trading Strategy
Bottom line: The US Dollar sell-off is testing a critical support zone and mutli-year uptrend support – looking for a reaction down here. From a trading standpoint, a good region to reduce short exposure / lower protective stop. Look for topside exhaustion ahead of 93.92 on recoveries IF price is heading lower with a close below 91.92 needed to fuel the next leg lower in price.

---
Key US Data Releases

Economic Calendar - latest economic developments and upcoming event risk.
Previous Weekly Technical Charts
- Euro (EUR/USD)
- Gold (XAU/USD)
- Japanese Yen (USD/JPY)
- Australian Dollar (AUD/USD)
- British Pound (GBP/USD)
- Australian Dollar (AUD/USD)
- Canadian Dollar (USD/CAD)
--- Written by Michael Boutros, Technical Strategist with DailyFX
Follow Michael on Twitter @MBForex


