


Nasdaq 100 index Technical Forecast: Neutral
- The Nasdaq 100 index formed a bearish “AB=CD” pattern and has since entered consolidation
- The index’s immediate support level can be found at 11,520 - the 50-Day SMA line
- The medium term trend appears bullish-biased, yet a “Double Top” could derail the uptrend
The Nasdaq 100 index likely formed a bearish “AB=CD” pattern in September, and has since entered a period of consolidation. The index has retraced almost 5% from the peak of 12,250, hitting a key support level at the 50-Day Simple Moving Average (SMA) before bouncing back (chart below). If the 50-Day SMA fails to hold, the index may decline further to test the next support level at 11,465 – the 76.4% Fibonacci retracement.
An “AB=CD” pattern is a classic harmonic pattern and is the building block of the more sophisticated “Gartley 222” pattern. An “AB=CD” pattern is formed by almost parallel AB and CD legs, which are similar in time frame and length (highlighted in red). A bearish “AB=CD” pattern is formed by two ascending AB and CD legs, and is usually followed by a correction after point D.
The index has just slipped below the 20-Day SMA, which is also the middle line of the Bollinger Band. When price enters into the lower half of the Bollinger Band, this usually signals further downside potential as the medium-term momentum has likely turned bearish. The MACD indicator has also formed a “Death Cross” this week, signaling that downward pressure may be prevailing in the days to come.
Nasdaq 100 Index – Daily Chart


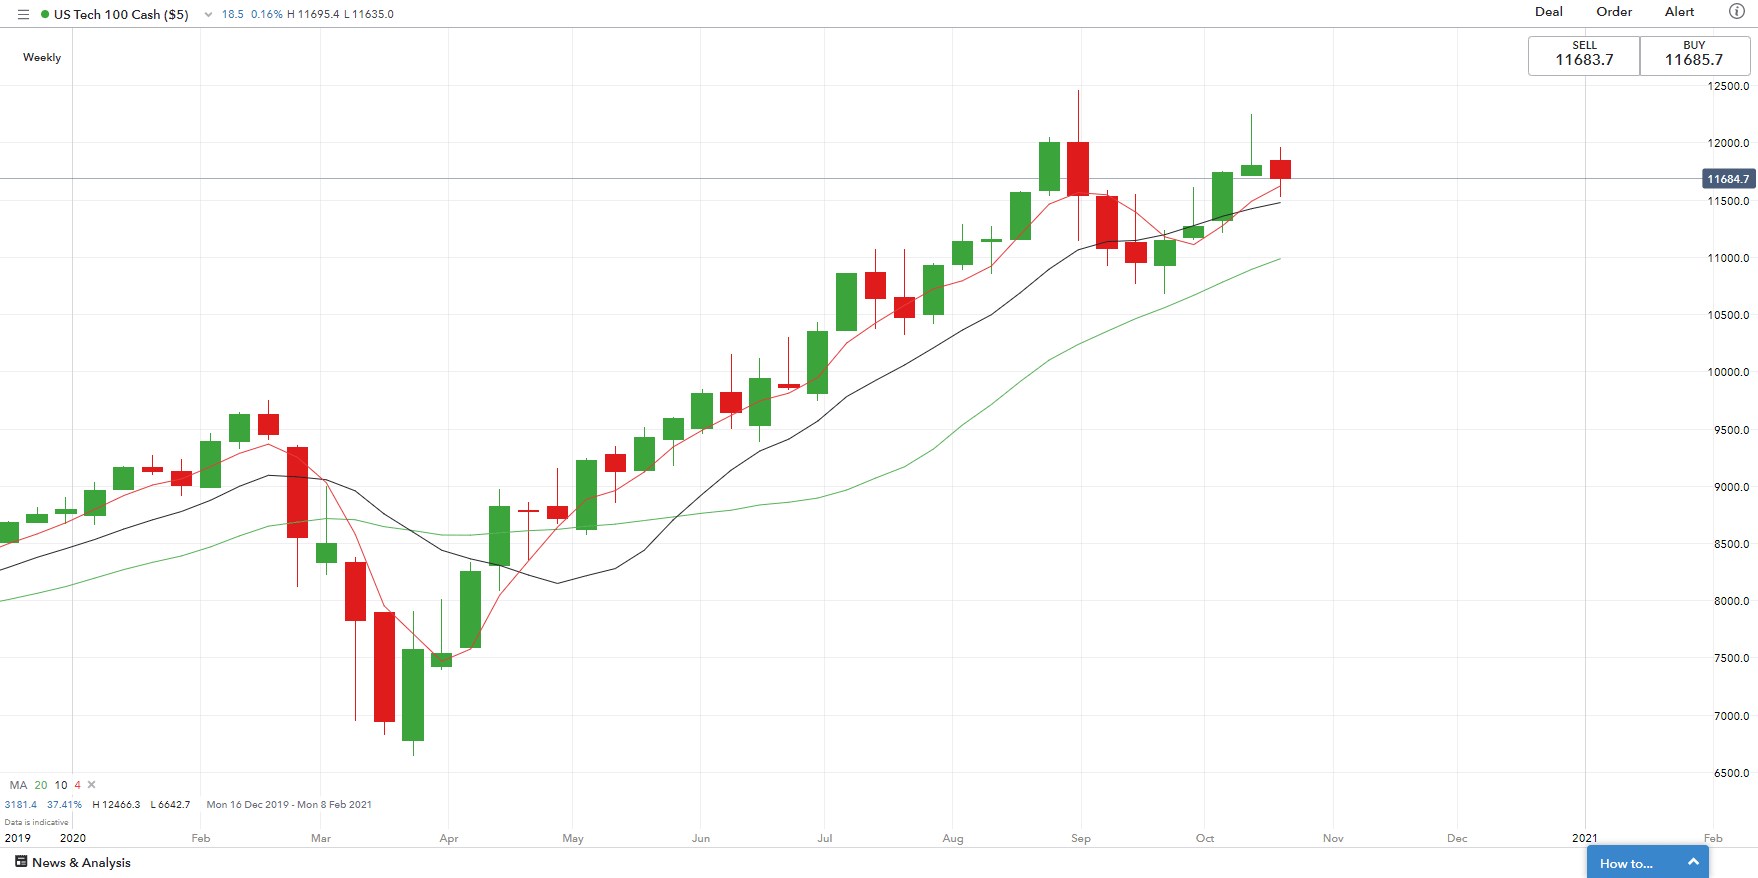
On the weekly basis, however, the Nasdaq 100 index appears to be taking a pause after registering a whopping 87% gain from March to August (chart below). The overall trend remains bullish-biased, with the recent consolidation potentially paving the way for higher highs. The 10-Week SMA line may serve as an immediate support, followed by the 20-Week SMA line.
In the medium term, a failure to break above September’s high of 12,260 may result in a “Double Top” pattern on the weekly chart, which could lead to a deeper pullback.
Nasdaq 100 Index – Weekly Chart

--- Written by Margaret Yang, Strategist for DailyFX.com
To contact Margaret, use the Comments section below or @margaretyjy on Twitter


