


USD/MXNTechnical Forecast: Bearish
USD/MXN heads into another week of downside momentum as the Mexican Peso continues to show resilience despite faltering risk appetite due to election and fiscal stimulus uncertainty.
US Dollar (USD) Presidential Election Performance May Prove Anything but Typical
For the past month we’ve seen USD/MXN consolidate downside momentum as an initial bearish breakout settled and the pair was left in a wide downward channel. But the range is tightening towards the end of the month, which could mean a reversal pattern is coming into play.
USD/MXN 1-hour chart (29 September – 23 October 2020)

As of now, the trend continues to be negative, as the pair has been able to hold on to bearish momentum, with the 1-hour chart showing a break of the previous support range between 21.30 and 21.15, although price action has revisited this area in a few occasions as the US Dollar tried to recover buyer support. The break of the psychological 21.00 level spurred selling action and a key support level is now in clear sight.
20.83 is the level at which the selling pressure back in September was halted, with USD/MXN unable to push below this level since the coronavirus pandemic started. This is a key level which is likely to bring further selling pressure if broken, but it’s going to take some effort to get there. If broken, the next objective would be to fill the coronavirus gap between 20.46 and 20.35, at which point bullish pressure is likely to kick in.
On the upside, short-term resistance can be found at 21.04, although a push above 21.30 is needed to consider 20.88 as an interim bottom. It is likely that selling pressure will increase in that area as new sellers see a good opportunity in the correction, but external risk factors could cause a rapid change in direction, taking USD/MXN back above 21.84.

USD/MXN Daily chart (07 January – 23 October 2020)
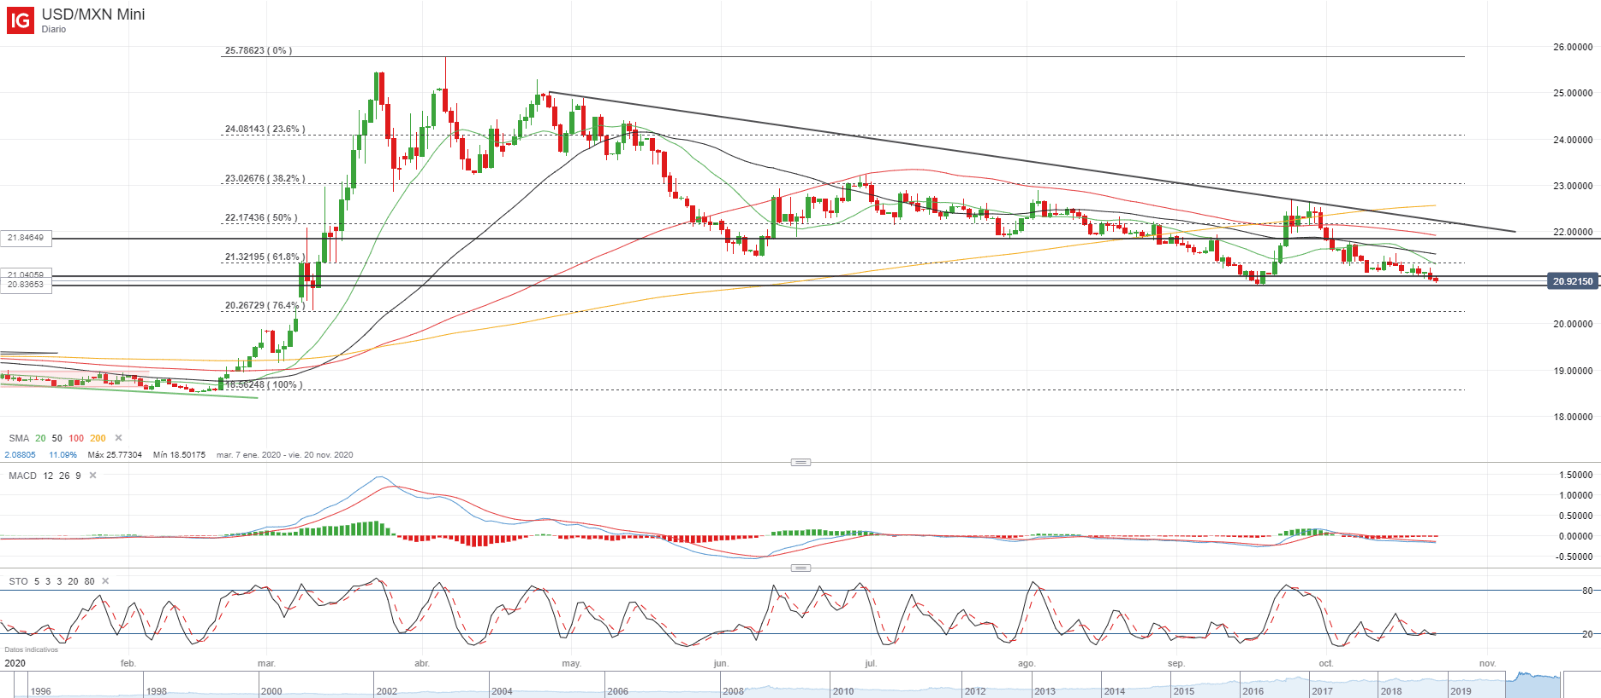
On a wider time-frame, the daily chart shows a descending trendline formed by lower highs since mid -April acting as resistanceat 22.16, which coincides with the 50% Fibonacci retracement from the 18.56 to 25.78 surge. With regards to moving averages, they are placed in descending order with the 20-day SMA having crossed below the 50-day SMA as a confirmation of further downside. That said, the stochastic is hovering below the 20 mark, which together with the narrowing range could indicate that a price reversal might be approaching.

--- Written by Daniela Sabin Hathorn, Market Analyst
Follow Daniela on Twitter @HathornSabin


