US Dollar, USD, EUR/USD, AUD/USD, GBP/USD Talking Points
US Dollar Technical Forecast: Bearish
- The US Dollar continues to give back September gains.
- GBP/USD was especially strong this week, nullifying a bear flag formation.
- AUD/USD may retain some reversal potential, which can remain of interest for those looking for long-USD scenarios.
- The analysis contained in article relies on price action and chart formations. To learn more about price action or chart patterns, check out our DailyFX Education section.
It was another week of selling for the US Dollar as the currency continues to unwind in October what it had gained in September. With now just one full week left in the month, and with a pensive Presidential Election around that corner, it seems that there’s little hope for USD-strength as the currency has been continually pushed-lower by stimulus hopes.
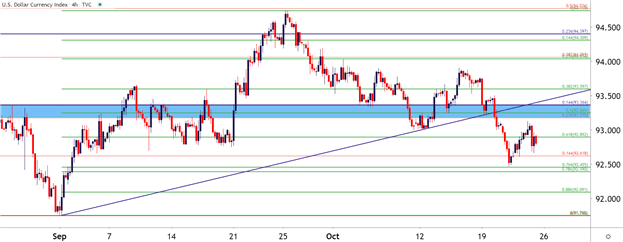
At this point, the USD is trading near a fresh monthly low that was set on Wednesday of this week. That fresh low bounced just before interacting with the 76.4% Fibonacci retracement of the September bullish move. The big technical event for this week was USD price action sinking below a big zone of confluent support, spanning from 93.18 up to 93.36. There was a bullish trendline in there, as well, but a forceful move on Tuesday shredded through that zone. This now opens up the possibility of that prior zone of support being re-purposed as short-term resistance; and this can be a theme to follow for early next week.
US Dollar Four-Hour Price Chart

Chart prepared by James Stanley; USD, DXY on Tradingview
EUR/USD Bounces from Big Support
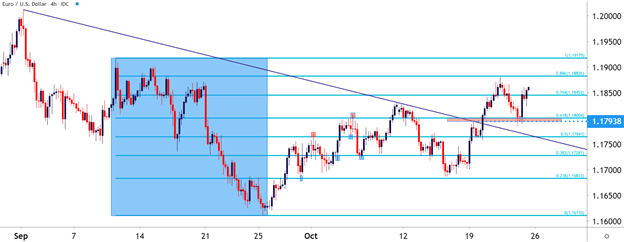
Going along with that re-emergence of USD weakness has been strength in the Euro, making for a really strong outing so far for the pair in the month of October. I had looked at the pair in the Tuesday webinar, focusing in on support in an area around the 1.1800 handle, which happens to also be the 61.8% Fibonacci retracement of the Sep 10-25 major move.
EUR/USD price action revisited this zone yesterday, and despite some slight penetration, a morning star pattern built as a short-term bullish reversal began to play through. This can keep the door open for topside continuation, making EUR/USD one of the more attractive venues to look for a continuation of USD-weakness in the week ahead.
Technical Forecast for EUR/USD: Bullish
To learn more about morning star patterns, check out our DailyFX Education section.
EUR/USD Four-Hour Price Chart

Chart prepared by James Stanley; EUR/USD on Tradingview
GBP/USD: The Bear Flag Violated as Bulls Continue to Drive
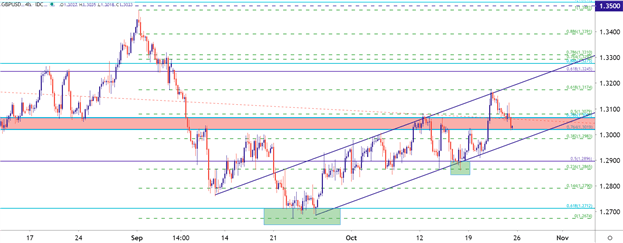
Last week I looked at a bear flag scenario in GBP/USD. After a tumble in September, buyers returned in October and this pullback had shown in a fairly clear manner, residing within a bullish channel for much of the time. As I had looked at in the Analyst Pick last week, failure from sellers to push through the support zone to elicit a downside breakout kept the door open for bullish continuation within the channel – pushing towards a re-test of the same 1.3000 level that had already induced a number of resistance inflections.
The only problem? 1.3000 didn’t offer much for resistance as buyers bid price straight through this zone, with channel resistance finally coming in to help mark the highs around 1.3175. Also of interest at this morning’s high is the 61.8% Fibonacci retracement of that September sell-off, which raises another interesting point: Bear flags should remain below the 50% marker of the initial move if the formation is to remain ‘in-play.’ That obviously didn’t happen here – and now buyers are showing higher-low support around another key price on the chart.
For next week, the forecast will be swapped to bullish based on violation of the 50% marker of that prior major move, combined with a higher-low support showing at a key area on the chart above the psychological 1.3000 level. The forecast for GBP/USD will be set to bullish for the week ahead.
To learn more about bear flag patterns, check out our DailyFX Education section.
GBP/USD Four-Hour Price Chart

Chart prepared by James Stanley; GBP/USD on Tradingview
AUD/USD Bounce from Big Fig Support to Key Fibo Level
AUD/USD may retain some allure on the short-side, particularly for those looking at long-USD strategies. Given the past few weeks of weakness in USD, there may be a dearth of attractive long-USD options with bear flags being nullified and whatnot. But, AUD/USD may have some attractiveness for such.
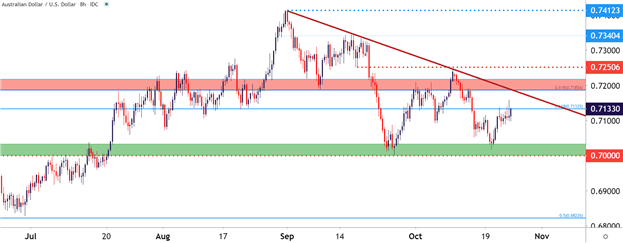
The pair was in a sparkling bullish trend through August, finally reversing in September. That reversal made a fast run back to the .7000 handle, at which point selling pressure dried up. But, that bounce was relatively short-lived, soon finding resistance in early-October as sellers came back into the pair. Prices then went down for yet another visit to the support zone around the .7000 big figure and, once again, a bounce has appeared.
But the dynamics in AUD/USD so far in October run in stark contrast to those in EUR/USD and GBP/USD. While both the Euro and the Pound have taken on bullish themes, AUD/USD continues to lag, and has remained below a bearish trendline connecting September and October swing-highs.
Also of interest – price action is currently seeing some resistance around the .7133 Fibonacci level. This is the 61.8% retracement of the 2018-2020 major move; and combined with the .7185-.7205 resistance zone along with that trendline, there’s plethora of possible resistance that can keep the door open for downside scenarios.
AUD/USD Technical Forecast: Bearish
AUD/USD Eight-Hour Price Chart

Chart prepared by James Stanley; AUD/USD on Tradingview
--- Written by James Stanley, Strategist for DailyFX.com
Contact and follow James on Twitter: @JStanleyFX


