


British Pound Technical Forecast: Bearish
- The British Pound was under pressure this week as hopes for a Brexit deal continue to fade.
- GBP/USD is brewing a bear flag formation and despite a quick probe-lower driven by bad news on Friday, prices pushed back-above a key area of support, keeping that flag in-play ahead of next week.
- GBP/JPY is also straddling on a big spot of support; but EUR/GBP may have a more amenable backdrop for longer-term GBP-weakness, as looked at below.
- The analysis contained in article relies on price action and chart formations. To learn more about price action or chart patterns, check out our DailyFX Education section.
Given the headlines out of the UK this week, it likely could’ve been worse for the British Pound. But in both GBP/USD and GBP/JPY, Sterling gave up value as odds of a Brexit deal continue to slim. This week was capped by the Friday announcement from Boris Johnson that the UK should prepare for a No-Deal Brexit in January. This prodded a quick sell-off in GBP/USD that spanned as much as 100 pips; but the pair quickly returned to trade above a key area of chart support. As discussed by our own Justin McQueen – nothing is official yet, and this could be just yet another step in the saga of Brexit negotiations as both the UK and EU have to currently contend with rising Covid numbers.
On that key area of chart support: As I had written on Thursday, GBP/USD appears to be setting up in a bear flag. This is marked by the formation of a bullish channel after an aggressive sell-off in the month of September; and the support side of that channel coincides with a key level derived from a longer-term Fibonacci retracement. The 50% marker of the 2016-2018 major move plots at 1.2896, and that’s lining up with the trendline projection of the bear flag.
This level was breached temporarily this morning on the back of that Boris Johnson news – but prices quickly returned and as we near the weekend, this flag remains in-play for next week.
To learn more about bear flags, join us in DailyFX Education
GBP/USD Four-Hour Price Chart

Chart prepared by James Stanley; GBPUSD on Tradingview
Taking a step back to look at the longer-term picture and a break of that bear flag can open the door for a move down to the September support zone around 1.2712. This is also a Fibonacci level, derived as the 61.8% retracement of the December-March major move. Below that, another zone of support potential exists surrounding the 1.2500 area; and if we do get an intense bout of risk aversion, or an extreme amount of selling in GBP as driven by Brexit headlines, this zone could quickly come into play.

GBP/USD Daily Price Chart

Chart prepared by James Stanley; GBPUSD on Tradingview
GBP/JPY Settles on Its Own Support
Also discussed in that Thursday article was a similar spot of support in GBP/JPY. There’s a Fibonacci level at 135.87 that’s been both support and resistance in a number of ways over the past month.
| Change in | Longs | Shorts | OI |
| Daily | -30% | -12% | -17% |
| Weekly | -29% | 3% | -5% |
We also now have the potential build of a falling wedge pattern, which will often be approached with the aim of bullish reversals. As I had said on Thursday, for those looking at ways to potentially take-on long-GBP exposure, GBP/JPY may be of interest; and that fact remains as we move towards next week.
To learn more about falling wedges, join us in DailyFX Education
GBP/JPY Four-Hour Price Chart
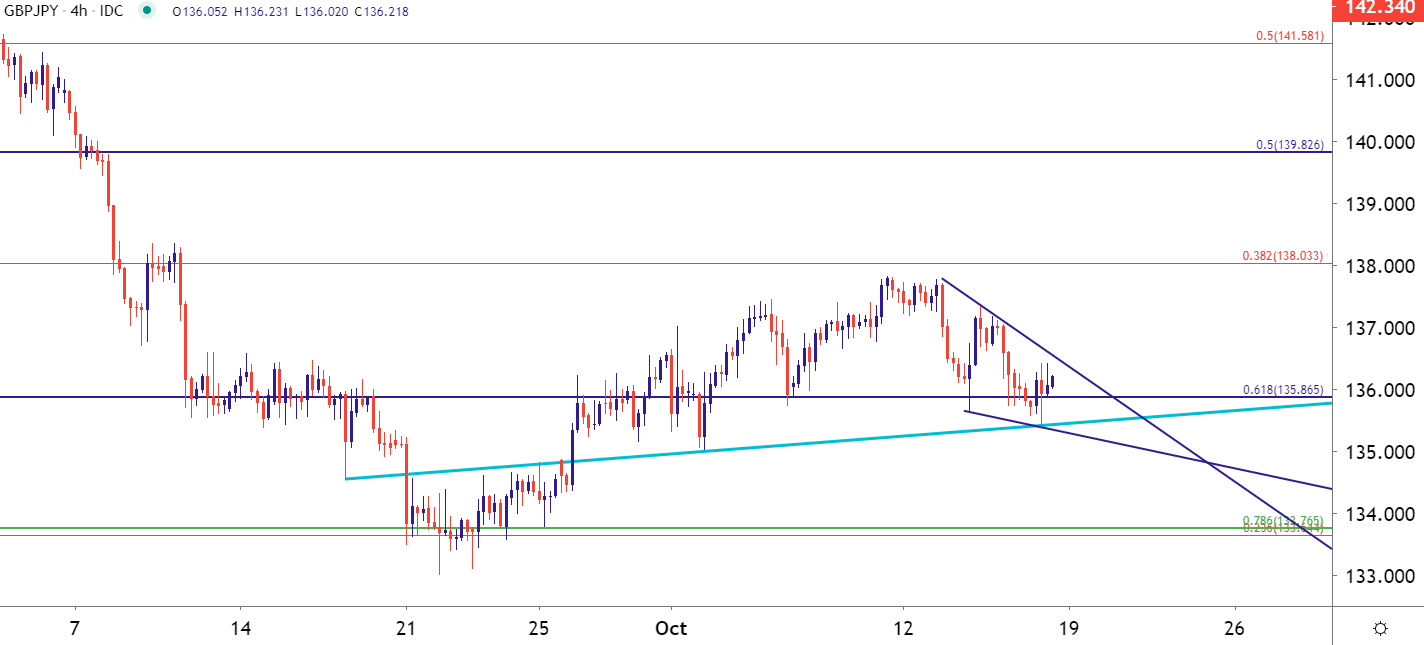
Chart prepared by James Stanley; GBPJPY on Tradingview
EUR/GBP Falling Wedge, .9000 Support Threaten Bullish Breakout
Back to the short-side of Sterling and EUR/GBP may be a venue of attraction. Similarly discussed on Thursday the pair has built into a longer-term falling wedge pattern. This setup has been brewing for more than a month now as price action has digested a recent bullish breakout. A build of support in the .9000-.9033 area on the chart has helped that pullback to slow down and given the build of the wedge, the door may soon be re-opening to bullish breakout potential.
This can keep EUR/GBP as perhaps one of the more attractive venues to hunt for GBP-weakness scenarios; and the forecast for next week will be set to bullish on the pair (bearish for GBP).
EUR/GBP Eight-Hour Price Chart

Chart prepared by James Stanley; EURGBP on Tradingview
--- Written by James Stanley, Strategist for DailyFX.com
Contact and follow James on Twitter: @JStanleyFX


