S&P 500 Index Technical Forecast: Bullish
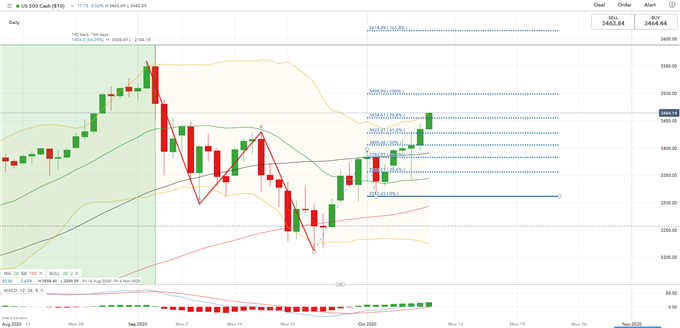
- The S&P 500 index climbed to one-month high after the formation of bullish “AB=CD” pattern
- The index tested the upper Bollinger Band, showing strong upward momentum
- Fibonacci extension suggests an immediate resistance level at 3,500 (100% Fibonacci extension)
The S&P 500 index has likely formed a bullish “AB=CD” pattern (see chart below) in September, and has since rebounded. “AB=CD” pattern is a classic harmonic pattern and is the building block of the more complicated “Gartley 222” pattern.
“AB=CD” is formed by almost parallel AB and CD legs, which are similar in time frame and length (highlighted in red). Similar AB=CD patterns can also be observed in Nasdaq 100 and Dow Jones index recently.
The S&P 500 index appears have reversed its bearish trend in the past two weeks, after completing the “AB=CD” pattern. It has since broken through the 20-Day and then 50-Day Simple Moving Average (SMA) lines, pointing to more upside potential.


The index is testing the upper Bollinger Band with an attempt to maintain its upward trajectory. Bollinger Band width is likely to widen further as the trend extends. This movement appears bullish-biased, although the upper Bollinger Band may also be viewed as an immediate resistance level.
Fibonacci extension drawings (chart below) show that S&P 500 has cleared its 61.8% Fibonacci extension (3,427) with an eye on the next resistance levels at 3,500 (100%) and then 3,615 (161.8%). A failure to reach or hold above 3,500 will likely lead to a technical pullback.
S&P 500 Index – Daily Chart

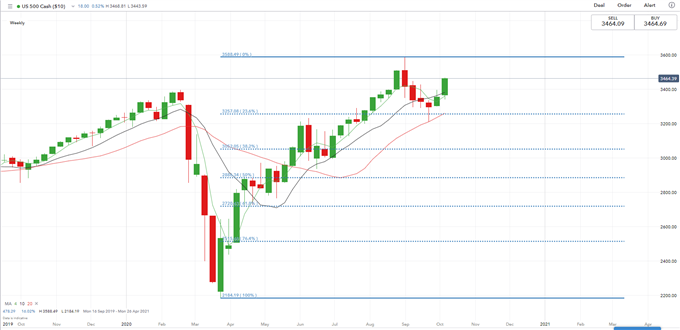
On the weekly basis, the S&P 500 index has regained strength over the last two weeks after four weeks of consolidation. The medium-term trend remains bullish-biased, well supported by the 20-Week SMA line (chart below). Drawing a massive Fibonacci retracement by picking its significant low (March) and all-time high (August) illustrates its major support levels. The S&P 500 appeared to have found strong support at the 23.8% Fibonacci retracement level at 3,250.
If this upward momentum can last, the S&P 500 index may test its all-time high at 3,588 after clearing an immediate 3,500 resistance in the weeks to come.
S&P 500 Index – Weekly Chart


--- Written by Margaret Yang, Strategist for DailyFX.com
To contact Margaret, use the Comments section below or @margaretyjy on Twitter


