


Australian Dollar Talking Points
AUD/USD trades around its highest level since August 2018 after tagging a fresh yearly high (0.7414) at the start of September, but failure to retain the upward trend from June may open up the 50-Day SMA (0.7120) as the exchange rate carves a series of lower highs and lows.
Technical Forecast for Australian Dollar: Neutral
AUD/USD has appreciated 30+% from the 2020 low (0.5506), with the exchange rate trading more than 3% higher from the start of the year clearing the January high (0.7016) in June.
In turn, the technical outlook for AUD/USD remains constructive as the exchange rate appears to have established an upward trend in the second half of 2020, and the Australian Dollar may continue to outperform its US counterpart as the trendline largely mirrors the positive slope in the 50-Day SMA (0.7120).
With that said, the pullback from the yearly high (0.7414) may end up being an exhaustion in the bullish trend rather than a change in market behavior as key market themes carry into September.

The IG Client Sentiment report shows the retail crowd has been net-short AUD/USD since April, with 41.92% of traders currently net-long the pair as the ratio of traders short to long stands at 1.39 to 1. The number of traders net-long is 3.81% higher than yesterday and 28.25% higher from last week, while the number of traders net-short is 14.92% lower than yesterday and 15.81% lower from last week.
The rise in net-long position has helped to alleviate the tilt in retail sentiment as only 37.17% of traders were net-long AUD/USD earlier this week, but the crowding behavior looks poised to persist as open interest narrows a mere 1.65% from the previous week despite the decline in net-short position.
Looking ahead, it remains to be seen if AUD/USD will preserve the upward trend from June as it carves a series of lower highs and lows, with a break of trendline support raising the scope for a move towards the 50-Day SMA (0.7120) as the Relative Strength Index (RSI) falls back from overbought territory.
AUD/USD Rate Daily Chart
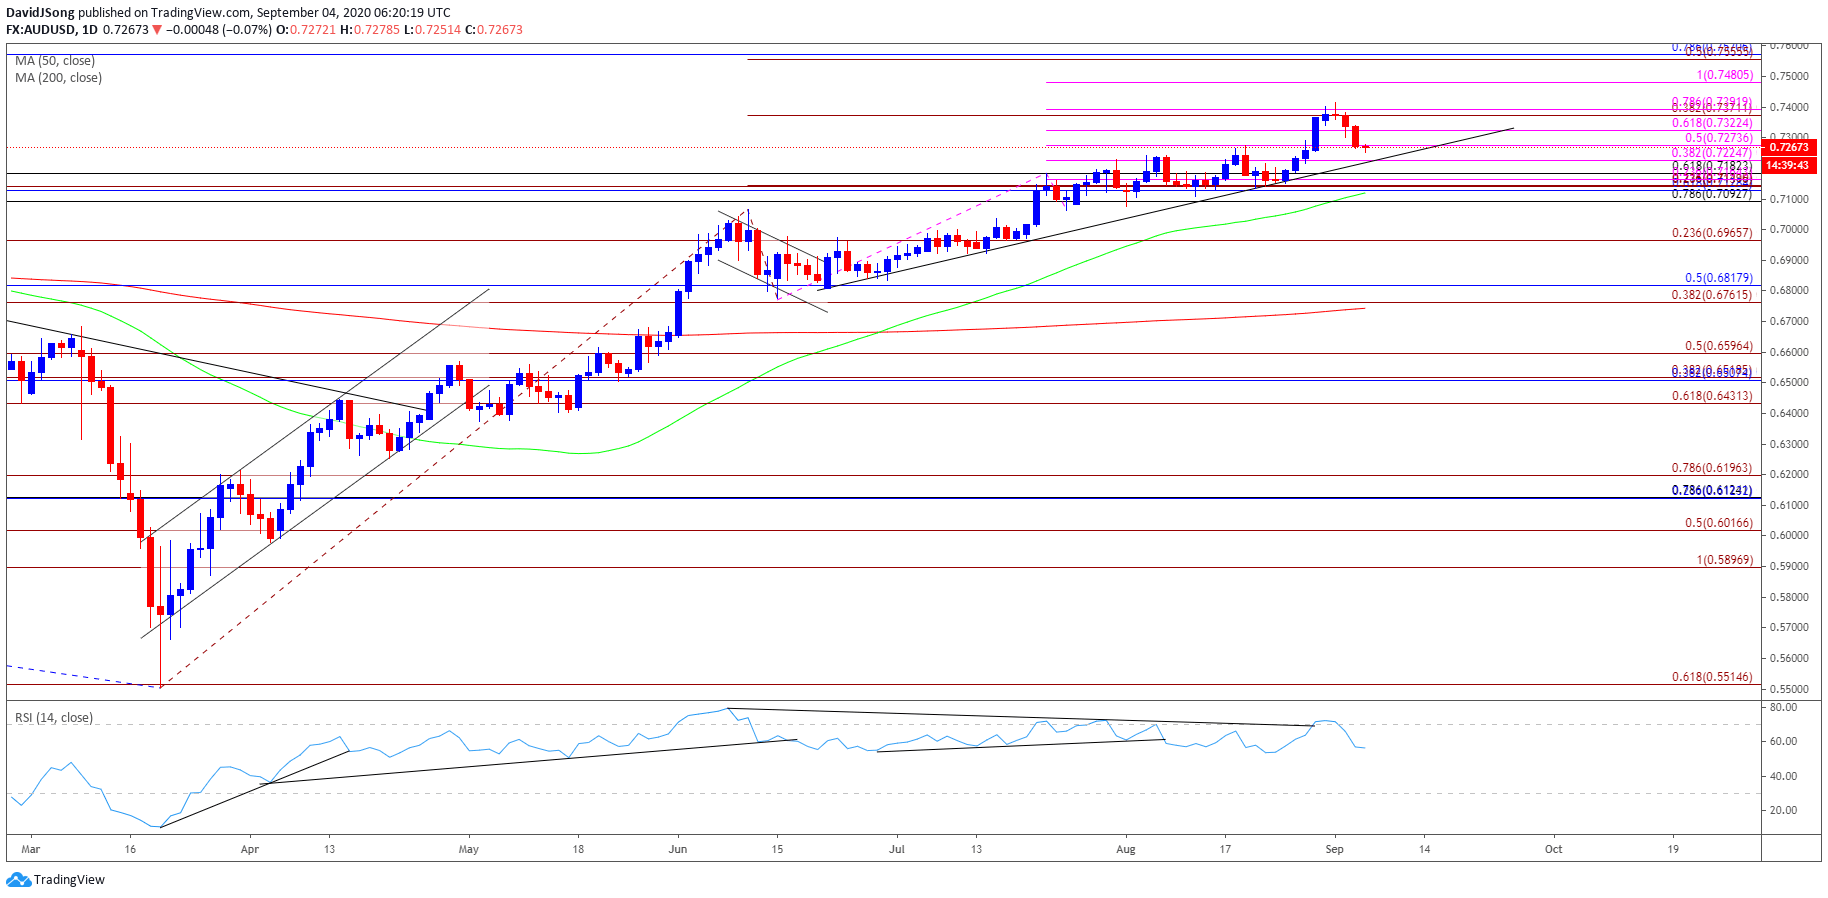
Source: Trading View
Recent developments in the RSI instilled a bullish outlook for AUD/USD as it threatened the downward trend from earlier this year to push into overbought territory, but a textbook sell-signal emerged at the start of September as the indicator quickly fell back below 70.
The bullish momentum may continue to abate following the failed attempt to test the July 2018 high (0.7484), with lack of momentum to close above the 0.7370 (38.2% expansion) to 0.7390 (78.6% expansion) region pushing AUD/USD towards trendline support.
A break of trendline support, which lines up with the 0.7230 (38.2% expansion) area, brings the 0.7180 (61.8% retracement) region back on the radar, with the next area of interest coming in around 0.7090 (78.6% retracement) to 0.7140 (23.6% retracement), which incorporates the 50-Day SMA (0.7120).
--- Written by David Song, Currency Strategist
Follow me on Twitter at @DavidJSong


