


USD/CAD Technical Forecast - BEARISH
- Canadian Dollar could be readying to extend gains versus the US Dollar
- The USD/CAD has taken out long and medium term rising support lines
- If CAD bounces, keep a close eye on key falling resistance from March
Canadian Dollar Technical Analysis
The Canadian Dollar is looking to confirm key technical breakouts against the US Dollar on multiple time frames. On the monthly chart below, USD/CAD can be seen readying to close under long-term rising support from 2012. While there are multiple barriers to breach further below, September could shape up to be an important month for the pair as it looks to perhaps extend declines over the medium term.

USD/CADMonthly Chart

Zooming in on the weekly chart shows that USD/CAD has also taken out medium term rising support from late 2017. Yet a key technical barrier sits below which is a combination of lows from July 2019 and January 2020. This makes for a zone of support between 1.2952 and 1.3015. Ahead, prices may struggle to push through this range should bulls take control.
USD/CAD Weekly Chart

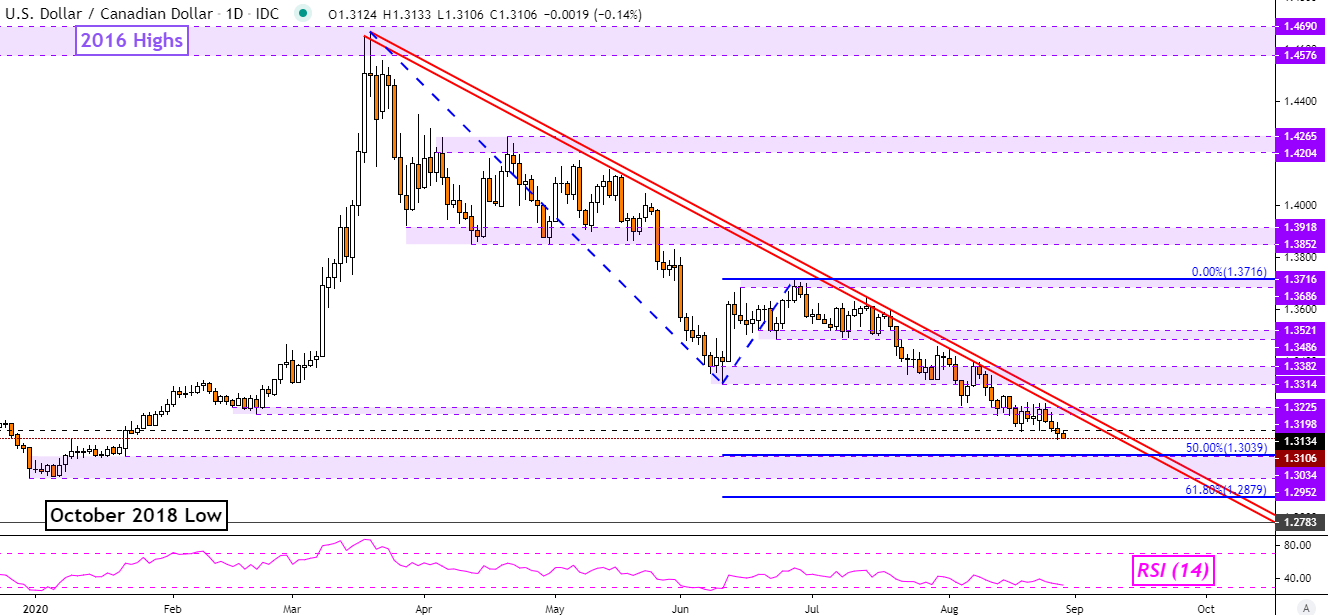
Now looking at the daily chart, a bounce off support may place the focus for USD/CAD on falling resistance from March – red parallel lines. Should the pair close above, that could open the door to a reversal of what has been the dominant downtrend. In such an outcome, keep a close eye on the 1.3314 – 1.3382 inflection zone. Breaching that range opens the door to testing former support at 1.3486 – 1.3521.
Otherwise, taking out key support at 1.2952 exposes the October 2018 low at 1.2783. On the way there, USD/CAD could encounter support at 1.2879 which is the 61.8% Fibonacci extension. For updates on the Canadian Dollar, you may follow me on Twitter here @ddubrovskyFX.
| Change in | Longs | Shorts | OI |
| Daily | 5% | -8% | -5% |
| Weekly | -5% | 1% | -1% |
USD/CAD Daily Chart
USD/CAD Charts Created in TradingView
--- Written by Daniel Dubrovsky, Currency Analyst for DailyFX.com
To contact Daniel, use the comments section below or @ddubrovskyFX on Twitter


