


US Dollar Price, News and Analysis:
- Chart set-up suggests a short-term bottom has been made.
- $148 billion auctions of 2-, 5- and 7-year USTs next week.

The daily US dollar (DXY) chart shows a bullish engulfing candlestick being formed today, following on from Wednesday’s strong uptick, suggesting that the recent sell-off in the greenback may over in the short-term at least. Weakness in the Euro is giving the DXY a decent nudge higher and while this remains the case, the dollar may have more room to run.
The greenback may find support next week from the US Treasury market, where $148 billion of 2-, 5- and 7-year notes are being auctioned off. Dealers and investors normally try to push UST yields higher ahead of new sales to try and get a better price/higher yield and this may well be the case again next week. Higher UST yields are supportive of the US dollar even when the current returns on offer are skinny at best.
Friday’s flash Markit PMIs for August helped underpin the recent uptick in the greenback, beating last month’s prints and expectations with ease. Existing month-on-month home sales (July) also beat expectations by a wide margin – +24.7% vs. a forecast of +14.7% - adding to the positive tone in the market.

Next week’s economic calendar reveals a handful of important US economic releases, all of which can make or break a move. News events are important for forex fundamental analysis and interpreting data is key when looking for hints about future moves.


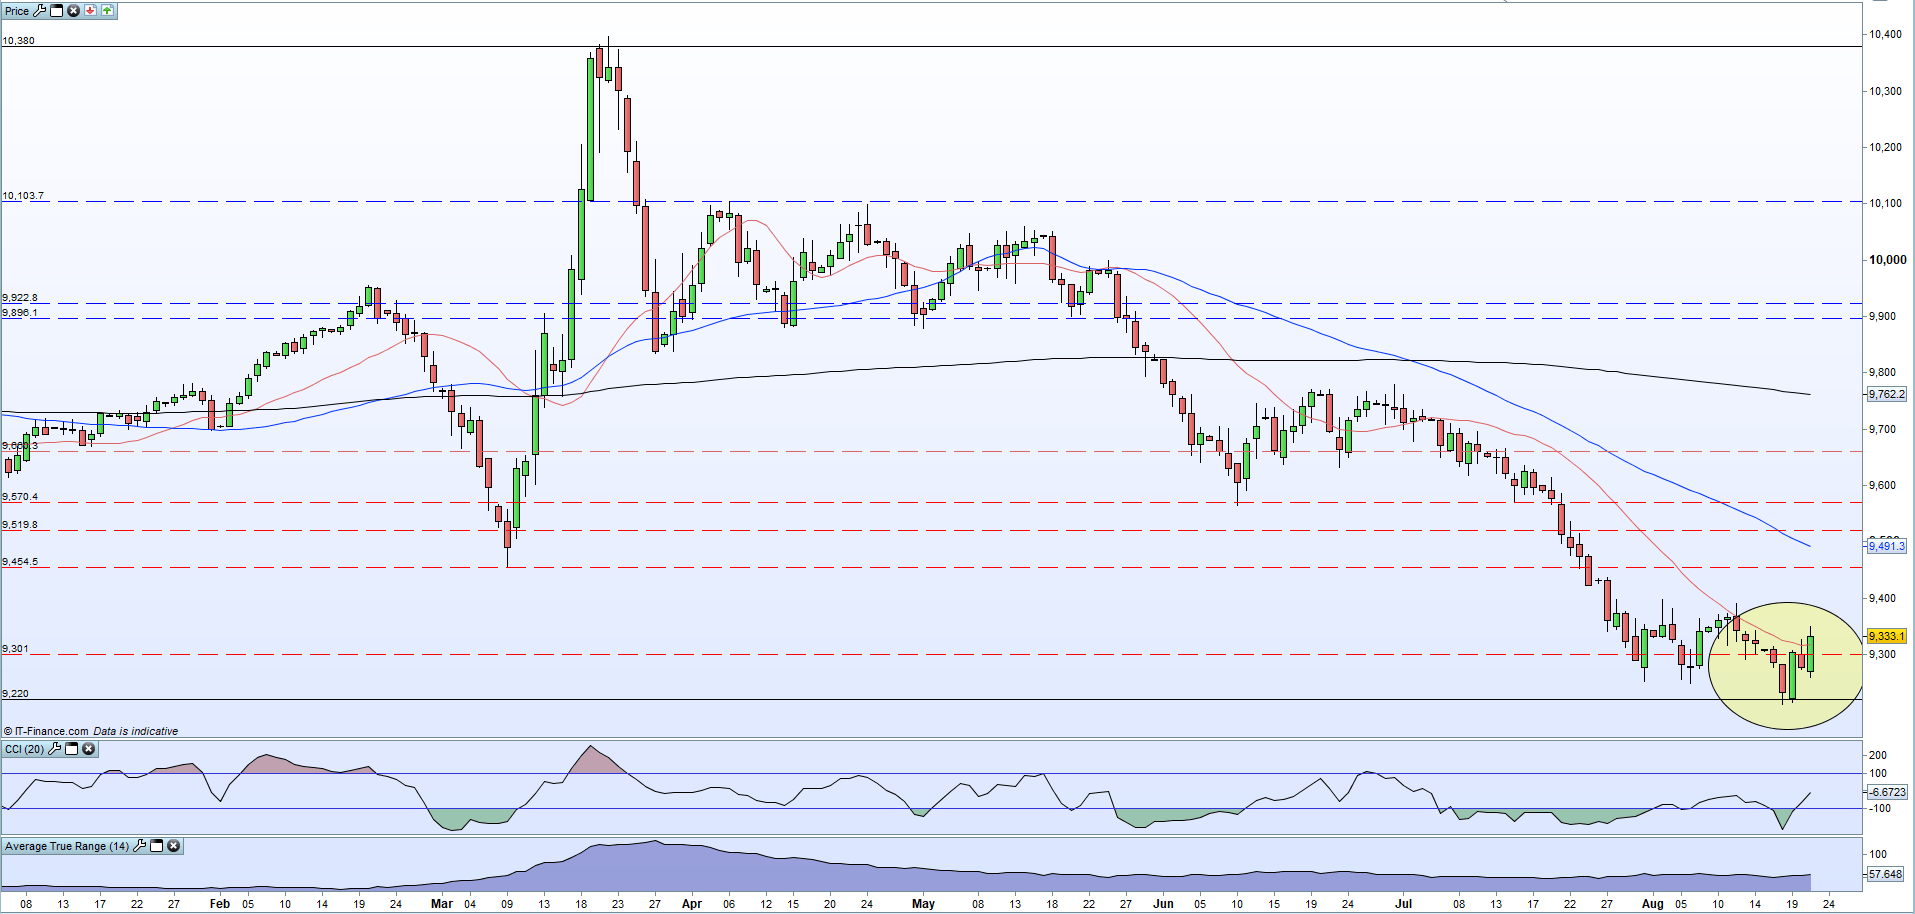
The daily US dollar basket (DXY) chart shows a bullish engulfing candlestick formed today, suggesting a reversal of the recent sell-off. On Wednesday the same pattern was near to being formed as well, suggesting that bullish sentiment is starting to build in the market. The DXY has also broken above the 20-dma and needs to close and open above here to give the move higher more credibility.
Top 10 Candlestick Patterns to Trade the Markets
While recent price actionand the above mentioned technical set-up suggests higher prices, while a general risk-on sentiment remains in the market, the greenback may struggle to push appreciably higher. The S&P 500 is at/or close to an all-time high, the Nasdaq continues to push into unchartered territory while Wall Street is closing in on its mid-February peak.
US Dollar Basket (DXY) Daily Price Chart (January – 21, August 2020)
What is your view on the US Dollar – bullish or bearish?? You can let us know via the form at the end of this piece or you can contact the author via Twitter @nickcawley1.


