


Gold Talking Points
The price of gold consolidates after trading to a fresh record high ($1981) in July, but the extreme reading in the Relative Strength Index (RSI) may be accompanied by higher gold prices like the behavior seen earlier this year.
Technical Forecast for Gold: Bullish
The price of gold has traded to fresh yearly highs during every single month so far in 2020, and the bullish behavior may carry into August as the RSI clears the February high (80), with the indicator registering a new extreme reading (88) for 2020 as bullion takes out the previous all-time highfrom September 2011 ($1921).
In turn, the rally in the price of gold may persist as long as the RSI holds above 70, with the trends based on simple moving averages highlighting a bullish outlook as the 50-Day SMA ($1784) and the 200-Day SMA ($1630) track a positive slope,
However, bullion appears to be finding resistance ahead of the psychologically important $2000 mark as it struggles to extend the series of higher highs and lows from the latter half of July, and the pullback from the record high ($1981) may lead to a near-term correction if the RSI flashes a textbook sell signal and slips below 70.
Until then, current market conditions may keep gold prices afloat as the extreme RSI reading is accompanied by crowding behavior in the US Dollar, with the IG Client Sentiment report still showing retail traders net-long USD/CHF, USD/JPY and USD/CAD, while the crowd remains net-short NZD/USD, AUD/USD, GBP/USD and EUR/USD.
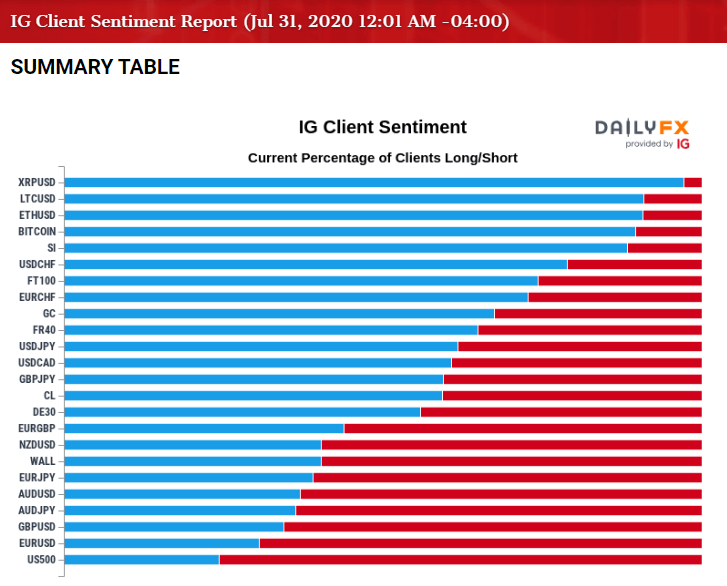
The net-long US Dollar exposure alsolooks poised to persist in August even though the DXY index plummets for sixth consecutive weeks, and the low interest rate environment along with the ballooning central bank balance sheets may continue to act as a backstop for the price of gold as market participants look for an alternative to fiat-currencies.
Gold Price Daily Chart
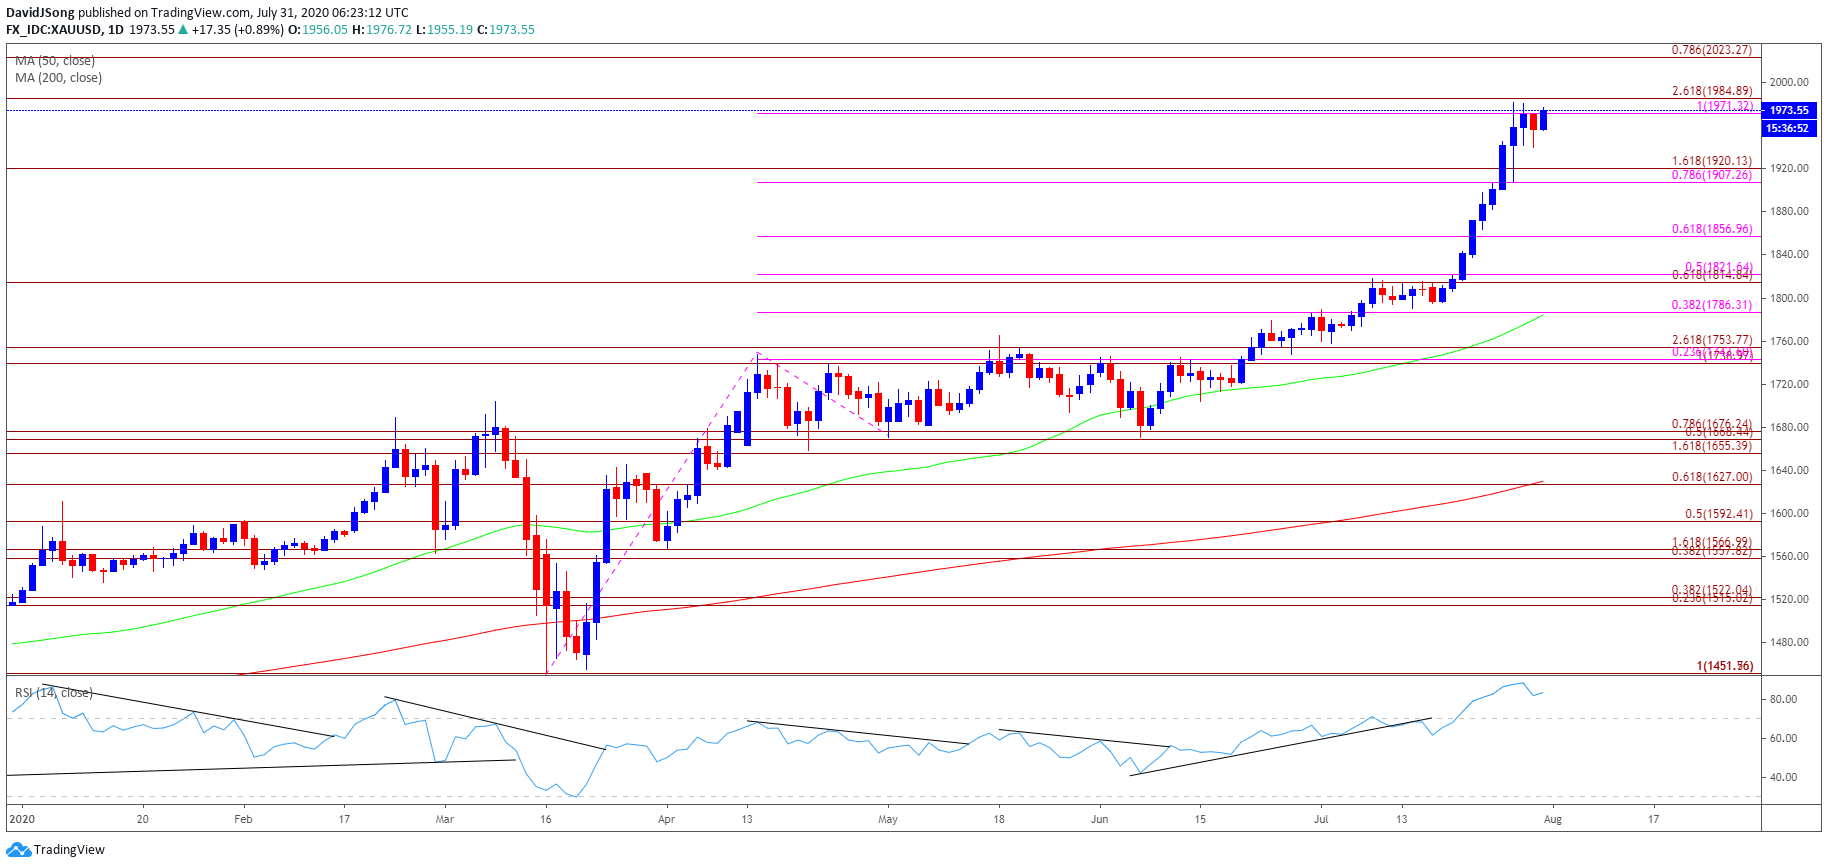
Source: Trading View
Keep in mind, the price of gold cleared the 2012 high ($1796) as the Relative Strength Index (RSI) established an upward trend in June, with the recent strength in the price of gold pushing the indicator into overbought territory for the third time this year even though it snapped the upward trend carried over from the previous month.
The extreme reading in the RSI is likely to be accompanied by higher gold prices amid the price action seen in February, and the bullish behavior may persist as long as the indicator holds above 70.
As a result, the psychologically important $2000 mark sits on the radar as the price of gold clears the previous all-time high from September 2011 ($1921), and a break/close above the Fibonacci overlap around $1971 (100% expansion) to $1985 (261.8% expansion) may push bullion towards the $2024 (78.6% expansion) region as the RSI sits in overbought territory.
Looking ahead, the RSI may help to validate when the price of gold has hit resistance once the indicator flashes a textbook sell signal and slips below 70.
--- Written by David Song, Currency Strategist
Follow me on Twitter at @DavidJSong


