


Weekly Technical Gold Price Forecast: Bullish
- Gold prices continue to maintain their consolidation just below their yearly highs, even as gold volatility pulls back further.
- Overall, gold prices remain on sturdy footing, both fundamentally (expansionary fiscal and monetary policies, producing negative real yields) and technically (bull flag consolidation during an uptrend).
- The IG Client Sentiment Index suggests that gold prices in USD-terms (XAU/USD) have a mixed outlook.

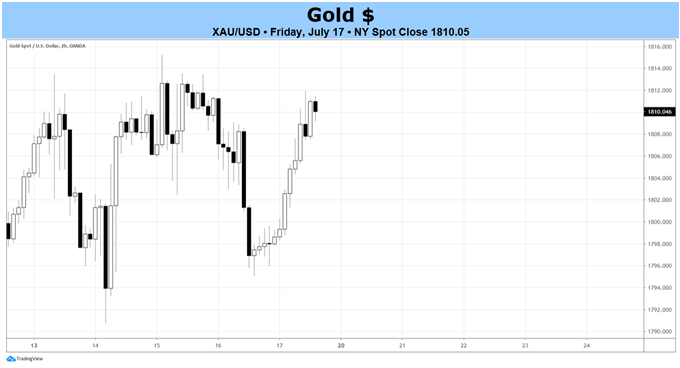
Gold Prices Week in Review
Gold prices finished higher versus most major currencies, although the places were gains were absent (XAU/AUD and XAU/EUR), losses were only minor. Gold in EUR-terms (XAU/EUR) lost -0.48% while gold in AUD-terms (XAU/AUD) fell by a mere -0.01%. Otherwise, the bullion market remains strong. Gold in USD-term (XAU/USD) added another +0.65%, continuing its consolidation below yearly highs (and its highest levels in almost nine years).
Overall, both the fundamental and technical backdrops for gold prices remains robust. Thanks to expansionary monetary policy and thus far underwhelming fiscal policy responses, mixed with the global economic uncertainty brought about by the coronavirus pandemic, real yields continue to fall and remain depressed. An environment defined by depressed and/or negative real yields has historically proven bullish for precious metals.
Gold Prices Maintain Bull Flag Consolidation
Following the breakout to new highs in early-July, gold prices have traded sideways. Although the rally has cooled off, that doesn’t mean the technical structure is less bullish. In fact, it appears that a short-term bull flag has been carved out between the July 1 high at 1789.27 and the July 8 high at 1818.09. The measured move is for +/-28.82, calling for a bullish breakout target above resistance at 1846.91 or a bearish breakdown target below support at 1760.45 – the latter of which would constitute a break of the uptrend from the March and June swing lows.
Gold Price (XAU/USD) Technical Analysis: Daily Chart (July 2019 to July 2020) (Chart 1)
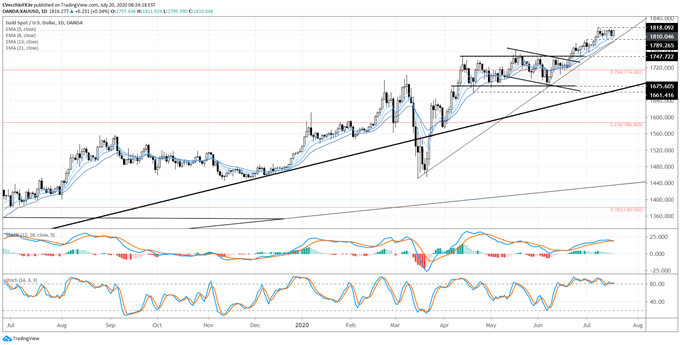
It’s worth noting that this short-term bull flag would look for gold prices to supersede the bullish breakout target from the sideways range carved out between the April 14/2020 high at 1747.72 and the April 21 swing low at 1661.42; was looking for a move up to at least 1821. This short-term bull flag would also see the completion of the inverse head and shoulders pattern that was initiated in Q2’19 (read more below).
For now, support still comes in at the daily 5-EMA, which gold prices have not closed below since breaking out on June 24.
Gold Price (XAU/USD) Technical Analysis: Weekly Chart – Inverse Head and Shoulders Pattern (July 2011 to July 2020) (Chart 2)
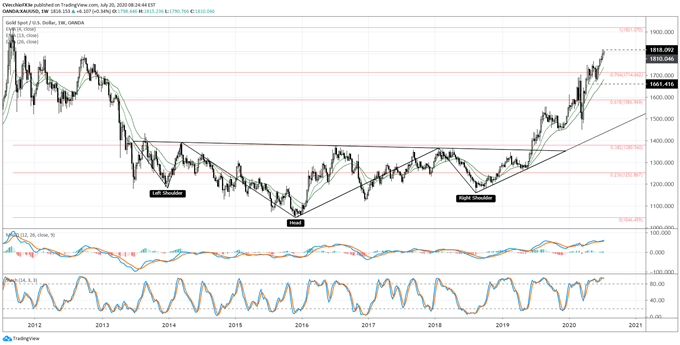
Gold prices have made significant progress within the confines of the multi-year inverse head & shoulders pattern, achieving their highest level since November 2012 earlier this week. It thus still holds that the rally into and through the 76.4% retracement (1714.66) must be viewed in context of the longer-term technical picture: the gold price inverse head and shoulders pattern that was triggered in mid-2019 is still valid and guiding gold price action.
Depending upon the placement of the neckline, the final upside targets in a potential long-term gold price rally, if drawing the neckline breakout against the August 2013 high at 1433.61, calls for a final target at 1820.99. This dovetails neatly with the measured move on the daily timeframe looking for gold prices to rally into 1834.02.
GOLD PRICE VERSUS COT NET NON-COMMERCIAL POSITIONING: DAILY TIMEFRAME (July 2019 to July 2020) (CHART 3)
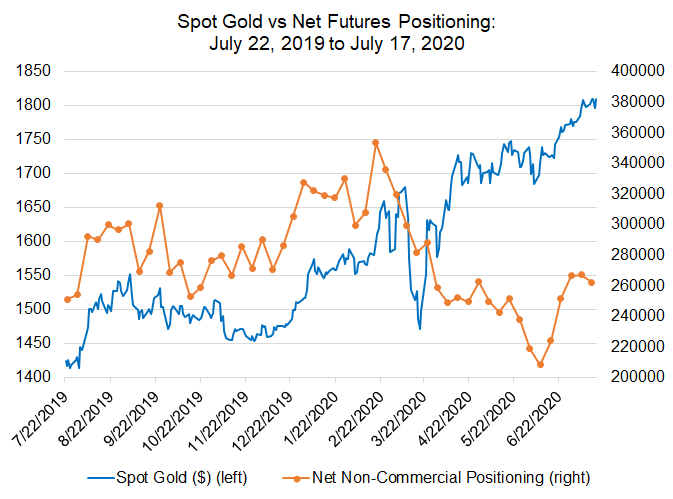
Next, a look at gold positioning in the futures market among speculators. According to the CFTC’s COT data for the week July 14, speculators decreased their net-long gold futures positions to 262.2K contracts, down from the 267.4K net-long contracts held in the week prior. Yet despite gold prices holding near their yearly highs, the futures market continues to see long positions ease, if only marginally: there were 266.7K were held by speculators during the week ending June 30, the largest net-long position in over three-months.
This is, perhaps, the most interesting aspect of the gold trade at present time: even as gold prices have rallied into fresh yearly highs, positioning in the futures market has not returned to its highs from earlier this year, when there were 353.6K net-longs held in February. The continued drawdown in net-longs held by speculators has been met by gold prices sustaining their gains; this is evidence of a strong market.
IG CLIENT SENTIMENT INDEX: GOLD PRICE FORECAST (JULY 17, 2020) (CHART 4)
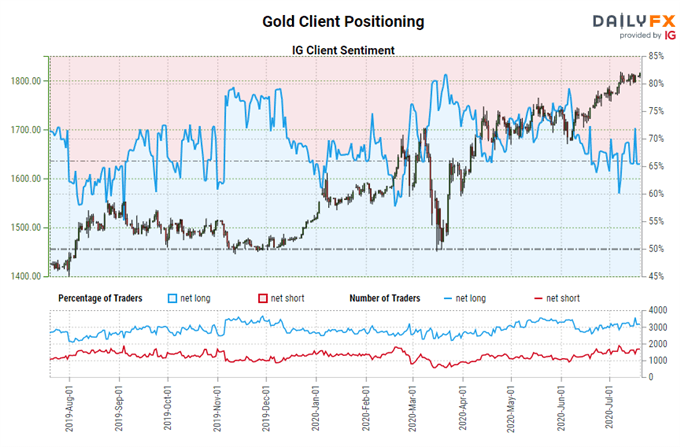
Gold: Retail trader data shows 65.56% of traders are net-long with the ratio of traders long to short at 1.90 to 1. The number of traders net-long is 4.11% higher than yesterday and 1.99% lower from last week, while the number of traders net-short is 2.79% higher than yesterday and 10.83% higher from last week.
We typically take a contrarian view to crowd sentiment, and the fact traders are net-long suggests Gold prices may continue to fall.
Positioning is more net-long than yesterday but less net-long from last week. The combination of current sentiment and recent changes gives us a further mixed Gold trading bias.

--- Written by Christopher Vecchio, CFA, Senior Currency Strategist


