


US Dollar Price Analysis:
- The US Dollar spent the bulk of this week grasping on to a big zone of longer-term support.
- This support test in USD syncs with a resistance test in EUR/USD, raising the possibility of a breakout in EUR/USD and a breakdown in USD on the basis of this weekend’s EU Summit.
- Can bears finally push DXY below the 95.00 handle? There was a quick flicker of weakness in March but that was quickly bid back-above this support zone.
US Dollar Vulnerable to EU Summit, EUR/USD Resistance
This is one of those weekends with the potential to create volatility when trading resumes on Sunday night; and as somewhat of a unique item, it appears that the US Dollar may be more driven by exogenous forces should that volatility show. The EU summit taking place over the weekend has the potential to produce some outsized volatility in a number of Euro-pairs, EUR/USD included. And given the importance of the resistance area currently being tested in EUR/USD, it’s difficult to deny the relationship with USD as the Greenback tests its own huge zone of support.
This opens up a backdrop for potential breaks, and if EUR/USD can finally muster a breakout above the stubborn 1.1500 level, then USD traders may finally see this huge zone of support give way. But to properly illustrate the matter, I’m going to start off with a weekly chart below, highlighting this key zone in blue, running from 95.86-96.05 on DXY. Notice that this blue zone held the lows through each weekly close going back to the early portion of last year. There was but one instance of violation at all, and that was in March of 2020, which we’ll touch on in a moment.
US Dollar Weekly Price Chart

Chart prepared by James Stanley; USD, DXY on Tradingview
US Dollar Goes Haywire in March, then Settles – Now What?
As noted above there was but one instance of a daily close below this key zone of support in the US Dollar, and that happened during a fairly pensive period in global markets. Initially, as the coronavirus was getting priced-in, noted by stocks selling-off as bond yields fell, the US Dollar moved-lower and this lasted from late-February into early-March. On March 9th, which was a Monday, the US Dollar dropped precipitously after trading opened for the week, soon pushing down to a fresh yearly low below the 95.00 level on DXY.
But that move didn’t last for long, and it was just that March 9 candle that had closed below this support zone. Buyers came back – with a little bit of gusto and a lot of fear around global markets – to push the US Dollar higher by 8.8% over the next ten days, eventually crafting a fresh three-year-high. So, in less than two weeks, we had one of the most important currencies in the world dropping down to a fresh yearly low and then driving up to a new three-year-high; making for quite the backdrop going into Q2.
But Q2 turned out to be very quiet, with the bulk of that time seeing USD trade within a well-defined range. That range lasted through April and most of May, with sellers finally taking a swing in late-May with a move that drove through early-June trade. But this is when the 95.86-96.06 level re-emerged, and this zone finally helped to cauterize the bearish move as prices began to bounce back – once again, moving into a range-bound backdrop.
US Dollar Daily Price Chart
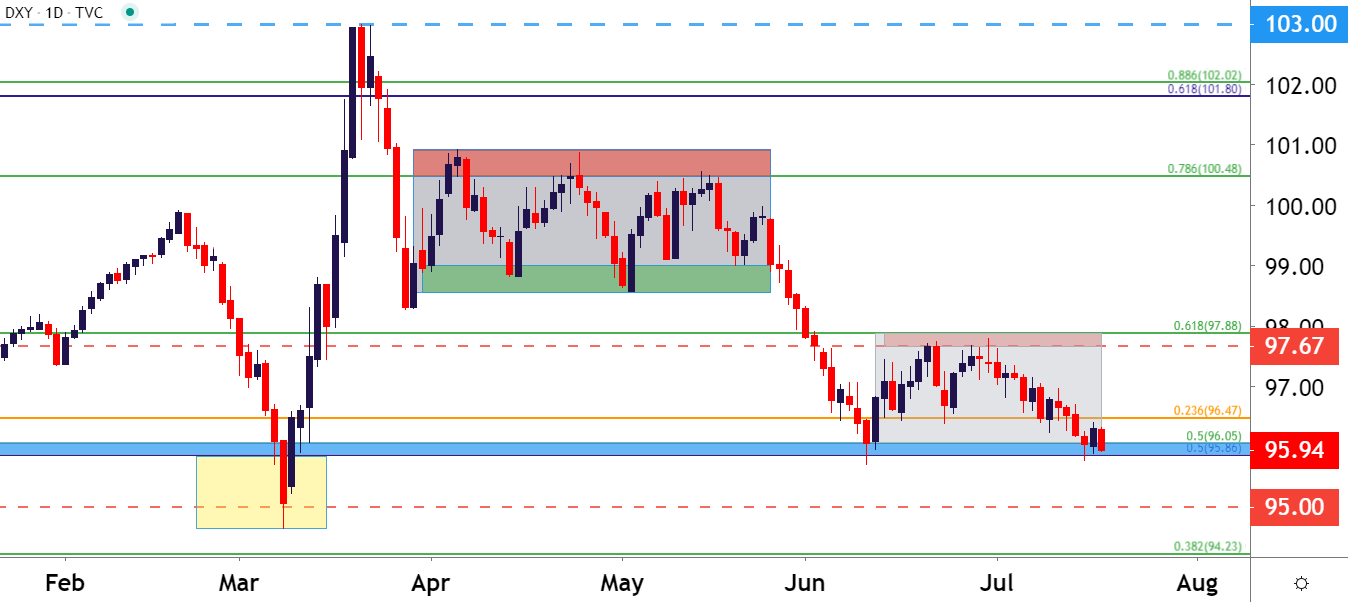
Chart prepared by James Stanley; USD, DXY on Tradingview
US Dollar So Far in Q3 – Return of the Bears
While that longer-term range remains in tact and even as that big picture support has helped to hold the lows, there may be near-by bearish potential in the currency, similar to what was looked at in the Q3 Technical Forecast for the US Dollar.

Selling pressure so far through the first couple of weeks of Q3 has maintained below a bearish trendline derived from the June 30th and July 10th swing highs. This, when combined with an element of horizontal support, creates a backdrop similar to that of a descending triangle.
US Dollar Four-Hour Price Chart
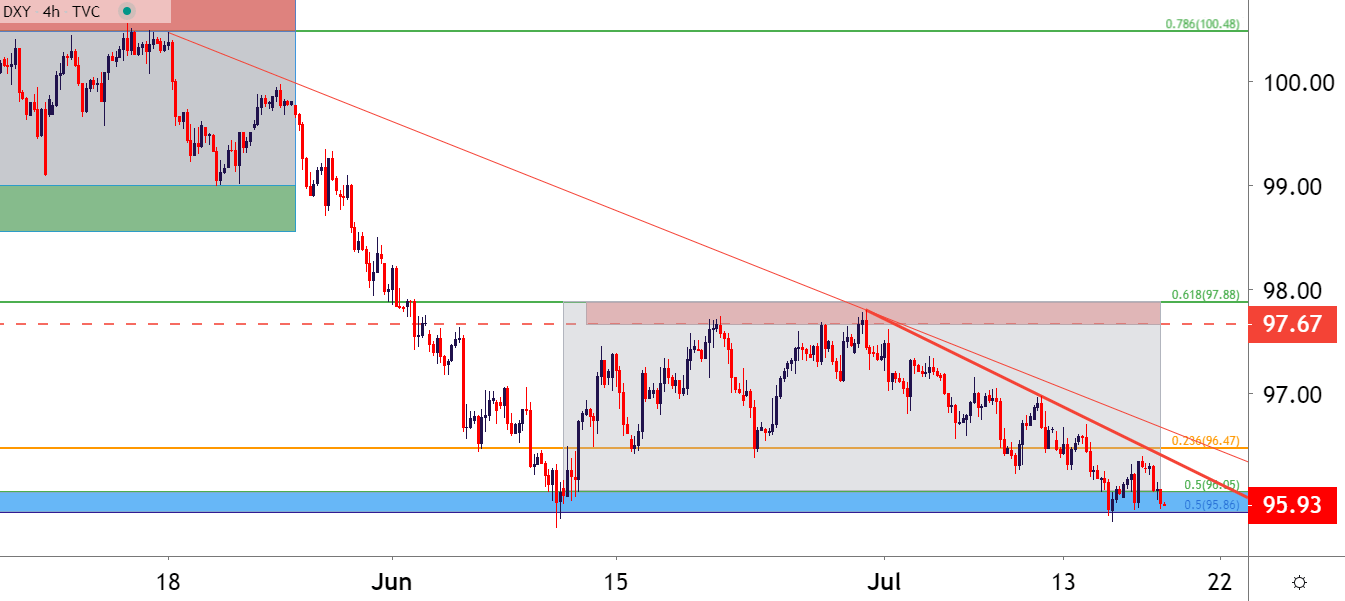
Chart prepared by James Stanley; USD, DXY on Tradingview
--- Written by James Stanley, Strategist for DailyFX.com
Contact and follow James on Twitter: @JStanleyFX


