


Crude Oil Technical Outlook
- Oil rallied to a multi-week high over a decline in US stockpile
- Brent oil price chart exposes a continuation pattern
Disrupted Rally
Last week, Brent oil hit a two-week high of $43.71 without committing to a new bull trend. Ultimately, the price slipped lower and closed the weekly candlestick with a Doji pattern and reflected the market’s indecision at that stage. Alongside that, the Relative Strength Index (RSI) rose remained flat above 50 and highlighted a paused bullish momentum.
This week, Oil prices have surged to a three-week high at $43.91 due to news of a sharp fall in US inventories as per data from the American Petroleum Institute. However, news about OPEC+ agreement to ease record supply curbs from next month, combined with the uncertainty of global recovery in fuel demand as new COVID-19 cases surge in several countries kept the lid on any further positive move.
Brent Oil DAILY PRICE CHART (Feb 1, 2019 – July 17, 2020) Zoomed Out
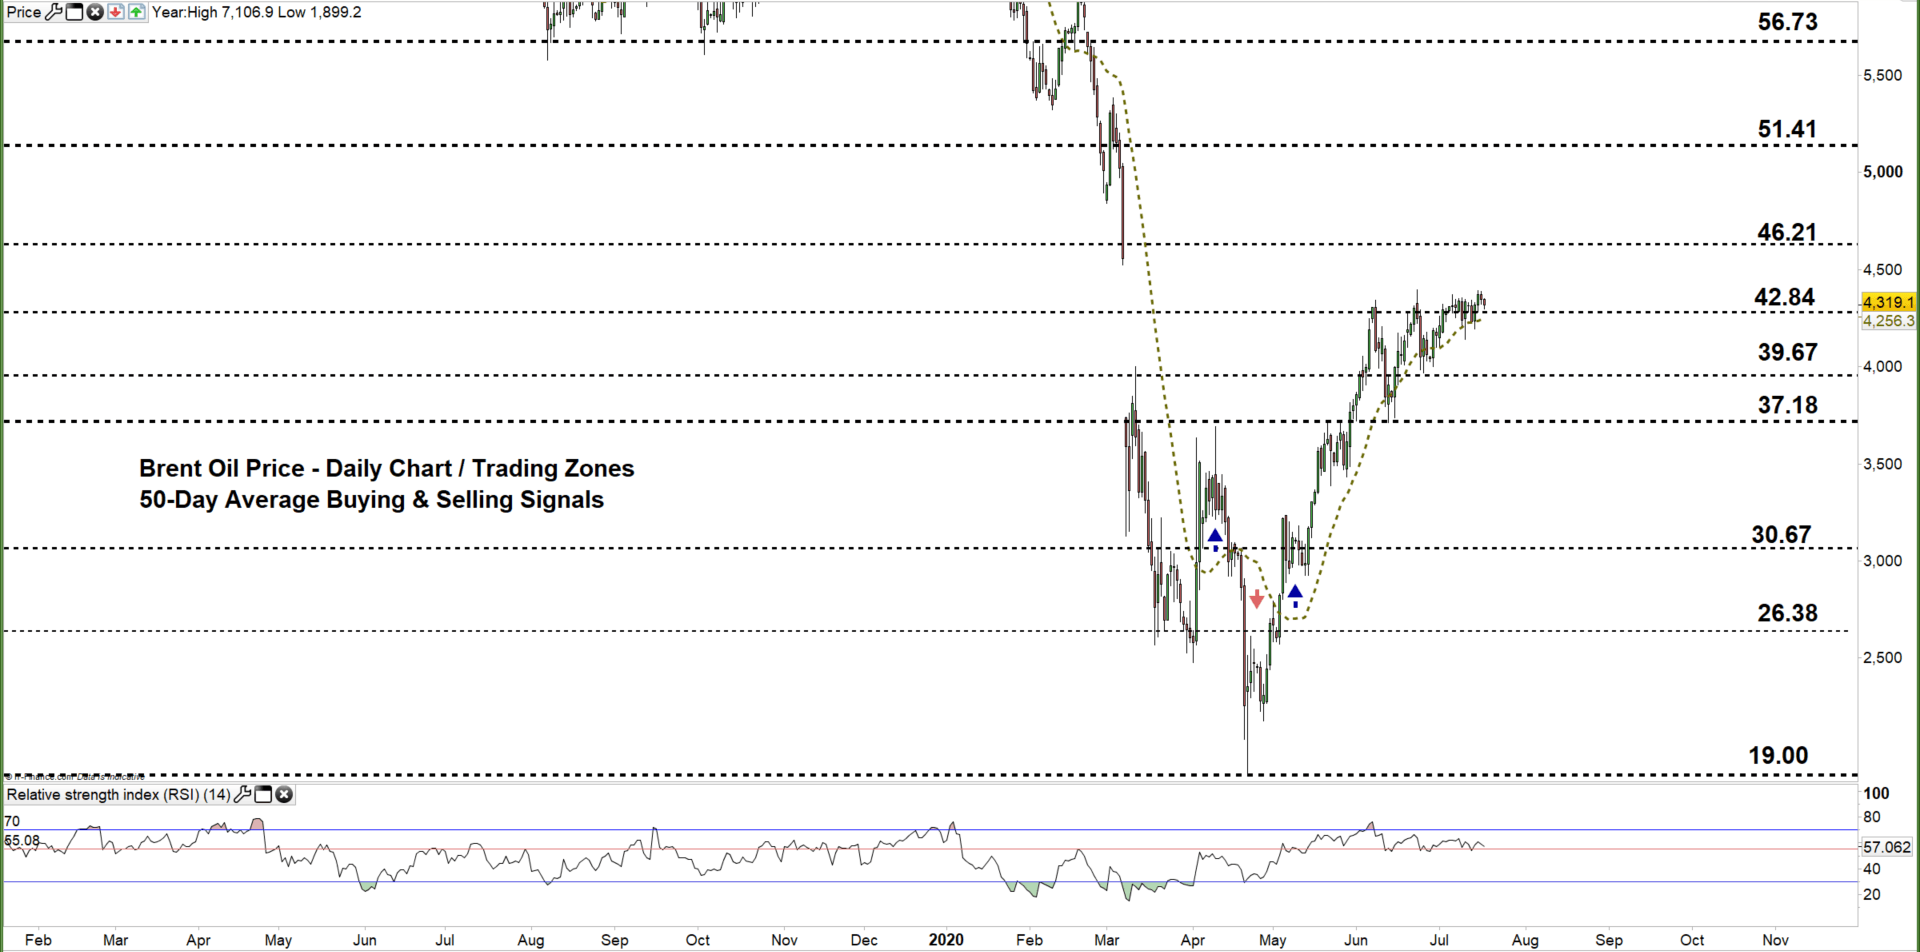

Brent Oil DAILY PRICE CHART (May 15 – July 17, 2020) Zoomed IN

On Tuesday, Brent rallied to the current trading zone $42.84 – $46.21. As we see the price failed twice to break above the upper line of an ascending triangle pattern located at $43.75 rebuffing efforts to resume bullish price action.
A close below the low end of the current trading zone may ultimately guide the Brent’s fall towards the weekly support level at $39.67, and a further close below that level could embolden bears to press towards the monthly support level at $37.18.
On the flip-side, the daily chart shows that the market rebounded around the low end of the current trading zone. Another close above that level may open up a push behind Brent oil towards the high end of the zone.
Brent Oil Four-Hour PRICE CHART (June 24 – July 17, 2020)
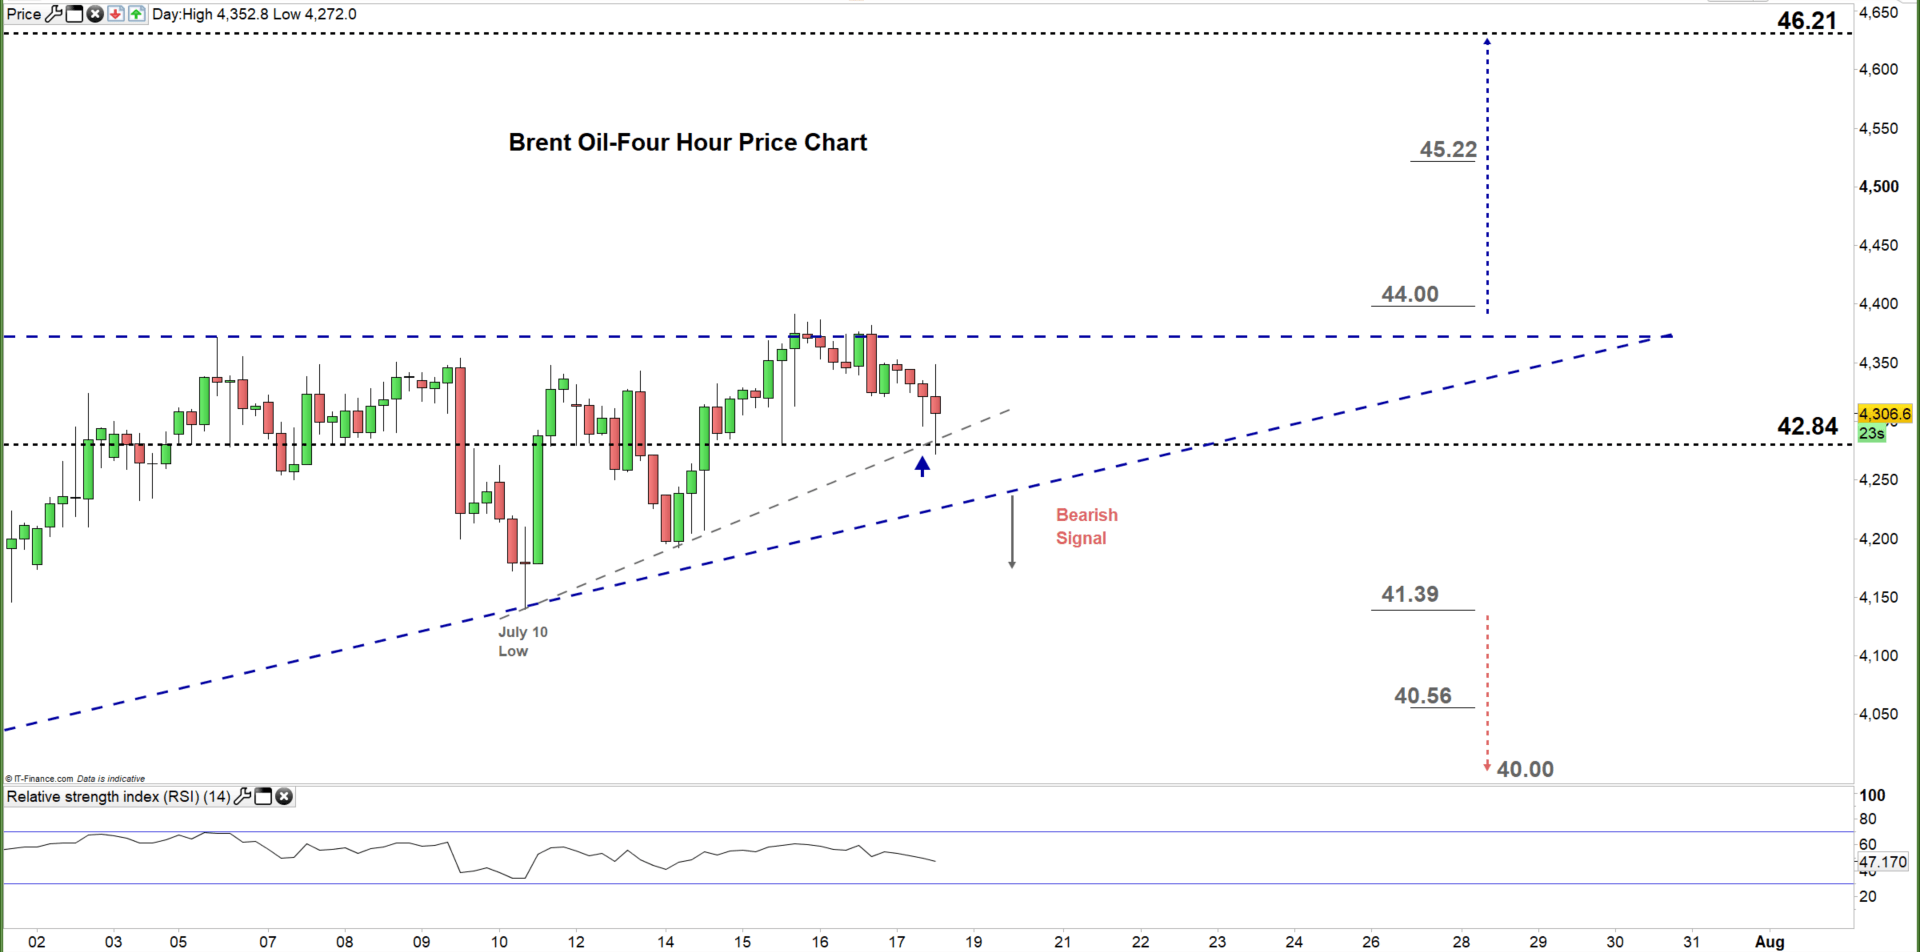
Crude oil today has rebounded from the bullish trendline support originated with the June 10 low at $41.39, and kept the bullish potential alive. That said, any break below the lower line of the ascending triangle would generate a bearish signal.
To conclude, a break above the psychological level $44.00 may trigger a rally towards the high end of the current trading zone discussed above on the daily chart, while a break below $41.39 could send Brent towards $40.00 mark. As such, the weekly support and resistance levels underlined on the four-hour chart should be watched closely.
Written By: Mahmoud Alkudsi, Market Analyst
Please feel free to contact me on Twitter: @Malkudsi


