


Australian Dollar Technical Price Outlook: AUD/USD Weekly Trade Levels
- Australian Dollar technical trade level update - Weekly Chart
- AUD/USD price in consolidation below key resistance at– 2019 /2020 yearly opens
- Aussie constructive while above 6660- Resistance at 7042 & 7120
The Australian Dollar is fractionally higher against the US Dollar this week with AUD/USD trading at 6938 in early New York trade on Friday. The advance seems to be stalling just ahead of a key resistance zone we’ve been tracking for months now and leaves the rally vulnerable heading into next week. These are the updated targets and invalidation levels that matter on the AUD/USD weekly price chart. for an in-depth breakdown of this Aussie trade setup and more.
Australian Dollar Price Chart – AUD/USD Weekly
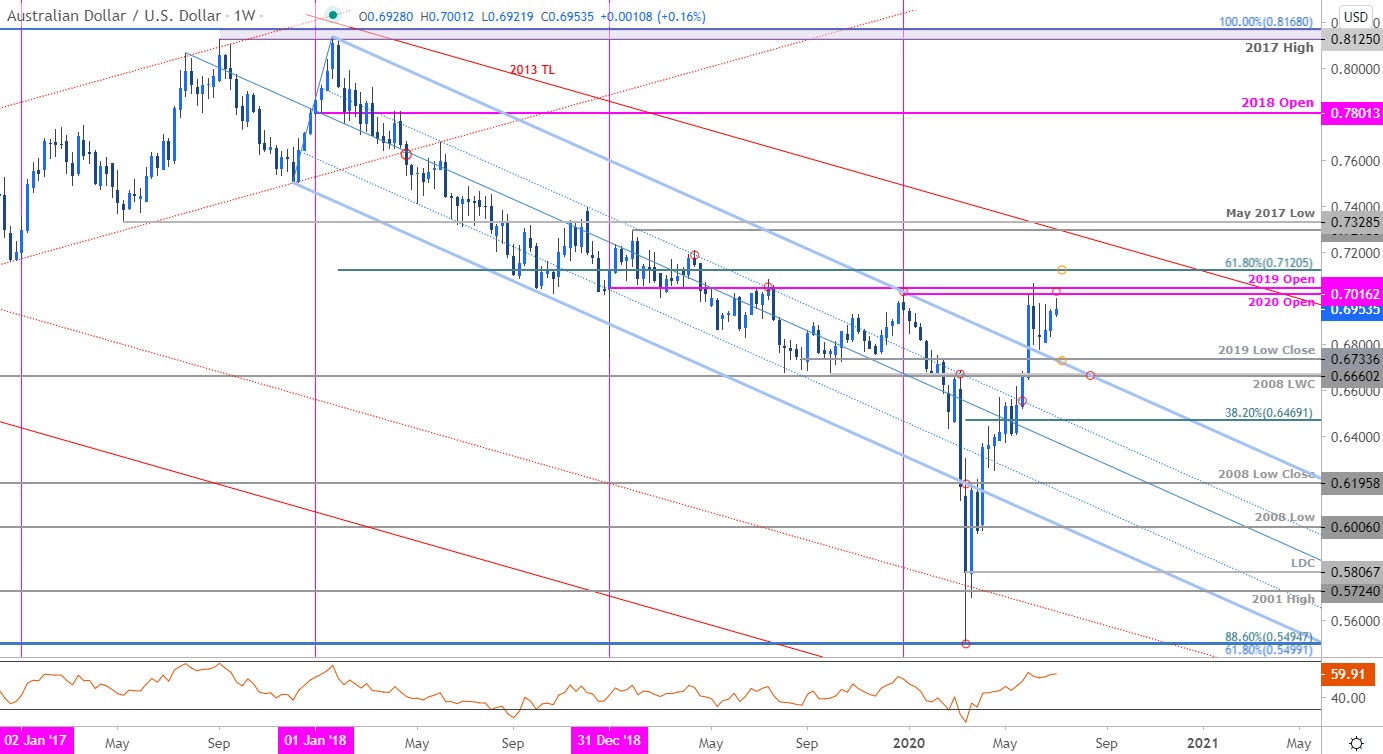
Chart Prepared by Michael Boutros, Technical Strategist; AUD/USD on Tradingview
Notes:In my last Australian Dollar Weekly Price Outlook we noted that the, “focus is on a break of this multi-week consolidation formation in the Australian Dollar with the broader rally vulnerable while below 7042.” The outlook remains unchanged heading into the close of the week and although Aussie is poised to close its third consecutive weekly advance, the rally remains vulnerable while below the 2020/2019 yearly open resistance at 7016/42.
A breach / close above this threshold is needed to mark resumption of the broader March rally with such a scenario eyeing subsequent topside resistance objective at the 61.8% retracement of the 2018 decline at 7120 and the 2018 swing high / May 2017 low at 7295-7328. Weekly support levels unchanged at the 2019 low close at 6733 with broader bullish invalidation steady at the 2008 low-week close / 2019 swing low at 6660/70.

Bottom line: The immediate once again is on this approach into key lateral resistance. From a trading standpoint, be on the lookout for possible topside exhaustion with the immediate long-bias vulnerable while below 7042. Ultimately, a larger pullback may offer more favorable opportunities closer to trend support with topside breach exposing the 2013 trendline. Review my latest Australian Dollar Price Outlook for a closer look at the near-term AUD/USD technical trade levels.
For a complete breakdown of Michael’s trading strategy, review his Foundations of Technical Analysis series on Building a Trading Strategy
Australian Dollar Trader Sentiment – AUD/USD Price Chart

- A summary of IG Client Sentiment shows traders are net-short AUD/USD - the ratio stands at -1.97 (33.70% of traders are long) – bullish reading
- Long positions are 0.53% higher than yesterday and 4.27% lower from last week
- Short positions are9.75% lower than yesterday and 2.39% higher from last week
- We typically take a contrarian view to crowd sentiment, and the fact traders are net-short suggests AUD/USD prices may continue to rise. Traders are less net-short than yesterday but more net-short from last week. The combination of current positioning and recent changes gives us a further mixed AUD/USD trading bias from a sentiment standpoint.
| Change in | Longs | Shorts | OI |
| Daily | -4% | 27% | 1% |
| Weekly | 6% | 8% | 7% |
---
Key Australia / US Data Releases
Economic Calendar - latest economic developments and upcoming event risk.
Previous Weekly Technical Charts
- Gold (XAU/USD)
- Japanese Yen (USD/JPY)
- Euro (EUR/USD)
- US Dollar (DXY)
- Canadian Dollar (USD/CAD)
- New Zealand Dollar (NZD/USD)
--- Written by Michael Boutros, Technical Currency Strategist with DailyFX
Follow Michael on Twitter @MBForex


