
GBP/USD Price Analysis & News
GBP/USD Confirms Q1 Bottom, However, Upside Challenges Remain
An impressive recovery throughout Q2 sees GBP/USD confirm a bottom from the Q1 sell-off. However, with upticks in the pair being met with corrective pullbacks, the pair looks set to be trading within a 1.24-1.28 range. That said, in the event of another rejection at the 1.28 handle, this could see GBP/USD look vulnerable to downside, provided that a double top is confirmed.

Chart 1: GBP/USD Rate Chart – Daily Timeframe (January to June 2020)

Source: IG; Prepared by Justin McQueen
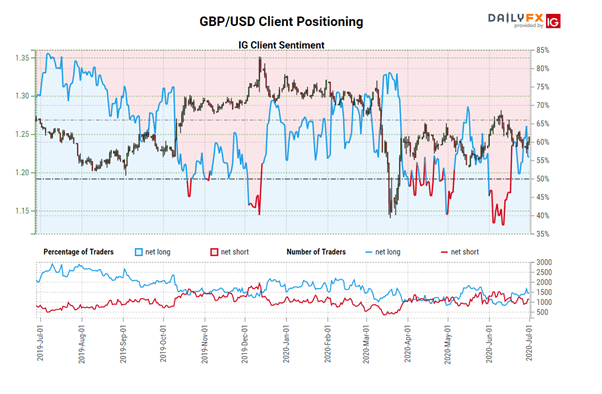
IG Client Sentiment: GBP/USD
GBPUSD: Retail trader data shows 42.3% of traders are net-long with the ratio of traders short to long at 1.36 to 1. The number of traders net-long is 9.2% lower than yesterday and 16.2% lower from last week, while the number of traders net-short is 6.4% lower than yesterday and 27.3% higher from last week.
| Change in | Longs | Shorts | OI |
| Daily | -2% | -11% | -5% |
| Weekly | 0% | 1% | 1% |
We typically take a contrarian view to crowd sentiment, and the fact traders are net-short suggests GBPUSD prices may continue to rise. Traders are further net-short than yesterday and last week, and the combination of current sentiment and recent changes gives us a stronger GBPUSD-bullish contrarian trading bias.