


US Dollar, USD Price Analysis
- The US Dollar built into a range-bound formation during this week’s trade.
- The bearish trend in USD that built through late-May in early-June appears to be on pause, with this week bringing a longer-term Fibonacci level into play to help set support.
- Next week should be big for US markets – it’s a short week with Friday being a federal holiday in observance of the Fourth of July. This means NFPs will be released on Thursday morning, going along with a series of additional high-impact releases on the economic calendar.
US Dollar Builds into a Range – but Can it Hold Through Heavy Data?
Into the end of Q2 the US Dollar has built into a range-bound formation; with a couple of inflections at both support and resistance. This range comes fresh on the heels of a bearish trend that developed from yet another range; and that one began to come into play after the March madness scenario started to wear off. March madness in the USD is reference to the 8.8% USD spike in the middle of the month, even as the Fed was cutting rates and beginning to announce emergency stimulus measures. Eventually, those cumulative actions began to soothe investors’ fears, bringing stock prices back to life (and then some); and the US Dollar has been in a pattern of retreat ever since.
At this stage, the US Dollar’s near-term range has been fairly well-defined. Support has built-in off of 96.47, which is the 23.6% Fibonacci retracement of the 2011-2017 major move. And resistance has held from around the 97.67 area on DXY.
US Dollar Four-Hour Price Chart
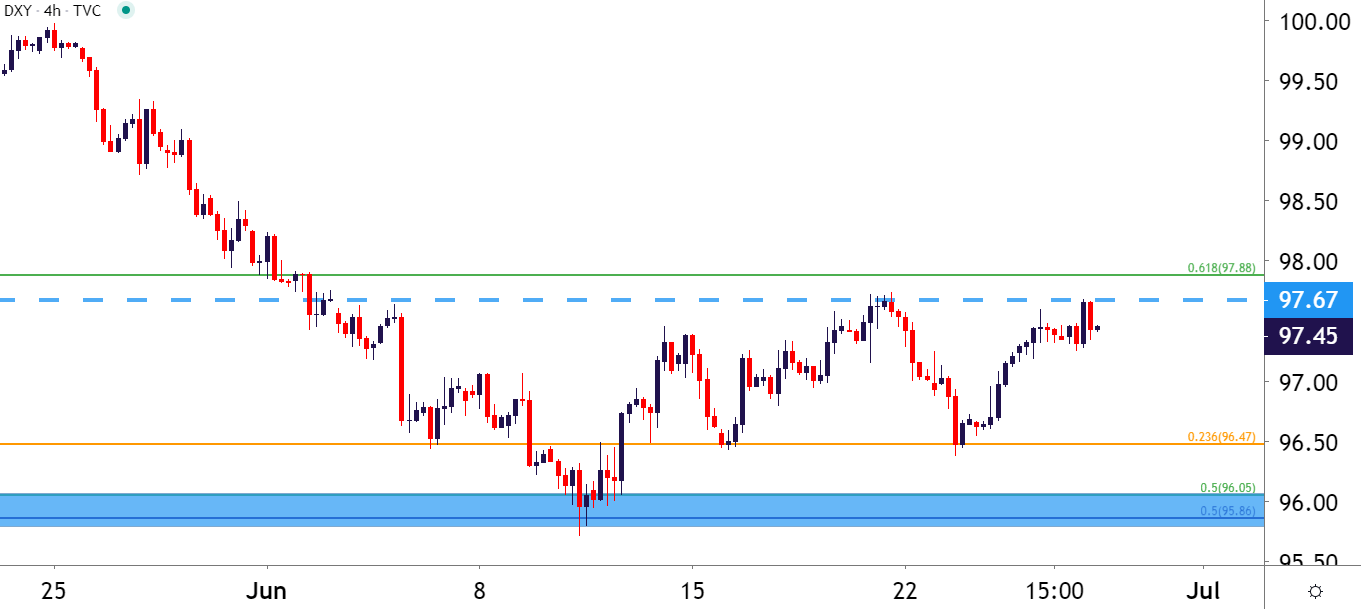
Chart prepared by James Stanley; USD, DXY on Tradingview
Get Ready for a Big Week on the Calendar
Next week is big in the US. Not only do we usher in the beginning of Q3, but we also have the 4th of July on Saturday. This is somewhat unique, as normally we’d see the Friday NFP print on the 3rd, but given that Federal agencies are observing the holiday then, it means that NFP will be released on Thursday the 2nd. But that’s not the only US item on the docket for next week, as I had discussed previously. Tuesday brings consumer confidence numbers, Wednesday brings PMI numbers and FOMC minutes, which should be quite interesting; and this is followed by the Friday NFP report.
This makes for a busy week to start Q3 trade and, given the recent range in the US Dollar, it’s logical to assume that the next directional move will emanate from the manner in which next week’s data flows.
DailyFX Economic Calendar – High-Impact US Events for the Week of June 30th

Taken from DailyFX Economic Calendar, next Seven days
US Dollar Bigger Picture: Bring Your Brooms, Because it’s a Mess
From longer-term charts, the mayhem in March is difficult to ignore; and it also somewhat obviates the prevailing forces of bigger picture trends. Ahead of that March move, the US Dollar had set up in a fairly bearish manner; initially building into a rising wedge, beginning to break down in Q4 of last year; followed by a pullback to resistance at prior wedge support after which another bearish move showed up – and that largely lasted until the March mayhem began.
And, looking at price action in the aftermath of that March move, it might be an understatement to call it ‘chaotic’ in nature; which is why that bearish trend that developed in late-May was so key, it highlighted a potential trend that may help to drive FX prices.

But that support around 96.47 in DXY has now helped to hold the lows for four consecutive weeks; making it a difficult prospect to expect matters to all-of-the-sudden change, unless there’s some exogenous push. That’s what next week calendar presents: An opportunity to push the currency back into a trend-mode, and this could mean that we’re in one of those very similar scenarios where bad economic data could bring on thoughts of even more stimulus, which could further weaken the US Dollar while providing another sugar rush to stock prices.
For near-term resistance potential, the area outlined on the below chart, around 98.54, could remain of interest as this prior point of resistance-turned-support may help to bring sellers into the fray should a bounce continue from the 96.47 Fibonacci level. The forecast for next week will be set to bearish for the US Dollar.
Technical Forecast for the US Dollar: Bearish
US Dollar Weekly Price Chart
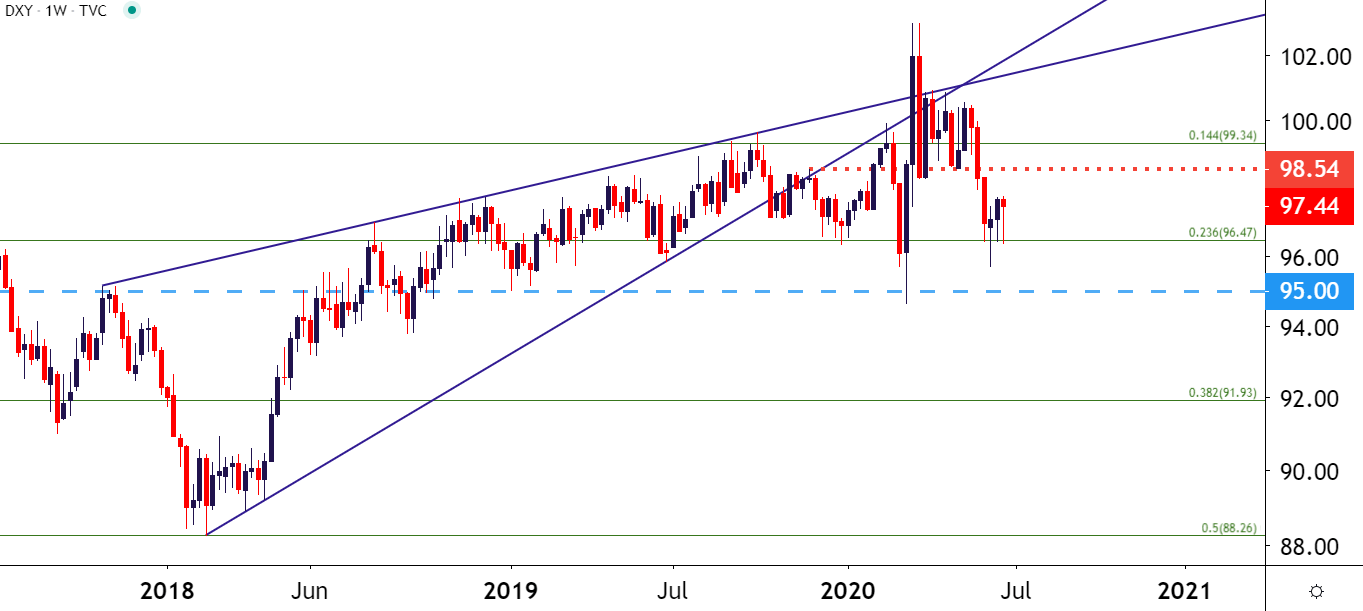
Chart prepared by James Stanley; USD, DXY on Tradingview
--- Written by James Stanley, Strategist for DailyFX.com
Contact and follow James on Twitter: @JStanleyFX


