


Dow Jones, CAC 40 & FTSE 100 Price Outlooks:
- The Dow Jones posted a series of lower highs as the Industrial Average weakens
- The CAC 40 remains locked between two nearby Fibonacci levels while the FTSE 100 threatens support
- Stock Market Basics: A Beginner’s Guide to Trading Stocks
Dow Jones Technical Forecast
Outlook: Bearish
Turmoil in equity markets continued last week as the Dow Jones, S&P 500 and even the Nasdaq slipped lower. While losses were more gradual than two weeks ago, the consistency with which stocks have fallen from their June peaks has seen the Dow Jones etch a concerning series of lower highs. As a result, a descending trendline projection can be drawn from the June 9 high and it seems the Dow Jones is vulnerable to further losses at this stage.
Dow Jones Price Chart: 4 – Hour Time Frame (February – June)

To that end, the Dow is quickly approaching an area of key importance marked by the swing low on June 15 at 25,525. If price probes 25,525 and breaks beneath, it would establish a lower-low which would effectively further the bearish pattern that has emerged since June 10. Thus, holding above the level in question might prove essential in staving of a continuation lower. Should the Dow fall further, subsequent support near the 24,000 mark may act as an early area of assistance.
CAC 40 Technical Forecast
Outlook: Neutral
The CAC 40 finds itself in a relatively strong position by comparison, a surprising turn of events for an index that has lagged the US leaders. Either way, it seems its slow churn higher has allowed it to avoid some of the steeper losses experienced by the Dow Jones, S&P 500 and Nasdaq 100. That being said, the CAC 40 remains trapped between a multitude of horizontal levels.
CAC 40 Price Chart: 4 – Hour Time Frame (February – June)
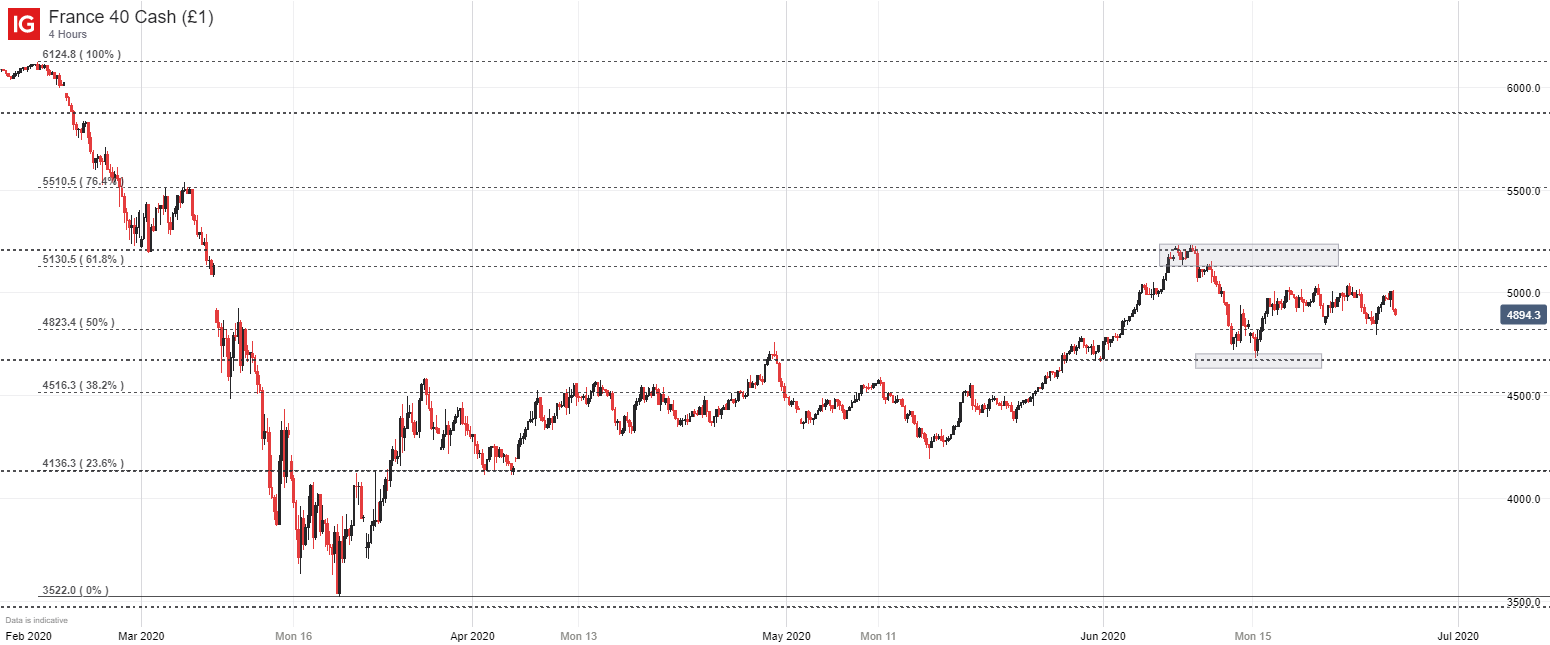
To the topside stands resistance from 5,130 to 5,215 which marks the index’s June swing high. On the other hand, possible support resides around 4,665 while the Fibonacci level at 4,823 might provide a modicum of influence. Regardless, the CAC 40 is likely stuck within the confines of the outlined levels for the foreseeable future, a fate which may give rise to range trading opportunities. In the meantime, follow @PeterHanksFX on Twitter for updates and analysis.
FTSE 100 Technical Forecast
Outlook: Neutral
Shifting our focus across the Channel, we can see the FTSE 100 has begun to develop a similar formation to that of the Dow Jones with a series of lower highs. Now the index will have to negotiate 6,200 if it is to recover while also considering the descending trendline projection nearby.
FTSE 100 Price Chart: 4 – Hour Time Frame (April – June)

Together the levels should offer some resistance and another leg lower at this stage might see the FTSE 100 post another lower low – a threat which the Dow also faces. Therefore, maintaining price action above the 6,060 and 5,930 levels is an important step in warding off further losses.
--Written by Peter Hanks, Analyst for DailyFX.com


