


Gold Talking Points
The price of gold has traded to fresh yearly highs during every single month so far in 2020, and the precious metal may continue to exhibit a bullish behavior in June as the pullback from the yearly high ($1765) reverses ahead of the May low ($1670).
Technical Forecast for Gold: Bullish
The price of gold tracks the May range ahead of the Federal Reserve interest rate decision, but the technical outlook remains constructive despite the failed attempt to test the 2012 high ($1796).
Keep in mind, the opening range for 2020 instilled a bullish outlook for gold as the precious metal cleared the 2019 high ($1557), with a similar scenario materializing in February as bullion tagged a fresh yearly high ($1689)after marking the monthly low ($1548) during the first full week.
The monthly opening range for March was less relevant amid the actions taken by major central banks in response to COVID-19, but the price for gold still traded to a fresh yearly high ($1704) prior to the break of the January low ($1517).
Bullion climbed to a fresh yearly high ($1748) in April following the reaction to the former-resistance zone around $1450 (38.2% retracement) to $1452 (100% expansion), with the bullish behavior also taking shape in May as the precious metal traded to a fresh 2020 high ($1765).
In turn, the 50-Day SMA and 200-Day SMA continue to track the positive slopes from earlier this year, and the low interest rate environment along with the ballooning central bank balance sheets may continue to act as a backstop for goldas marketparticipants look for an alternative to fiat-currencies.
With that said, the price for bullion may continue to exhibit a bullish behavior in June as the pullback from the yearly high ($1765) reverses ahead of the May low ($1670).
Gold Price Daily Chart
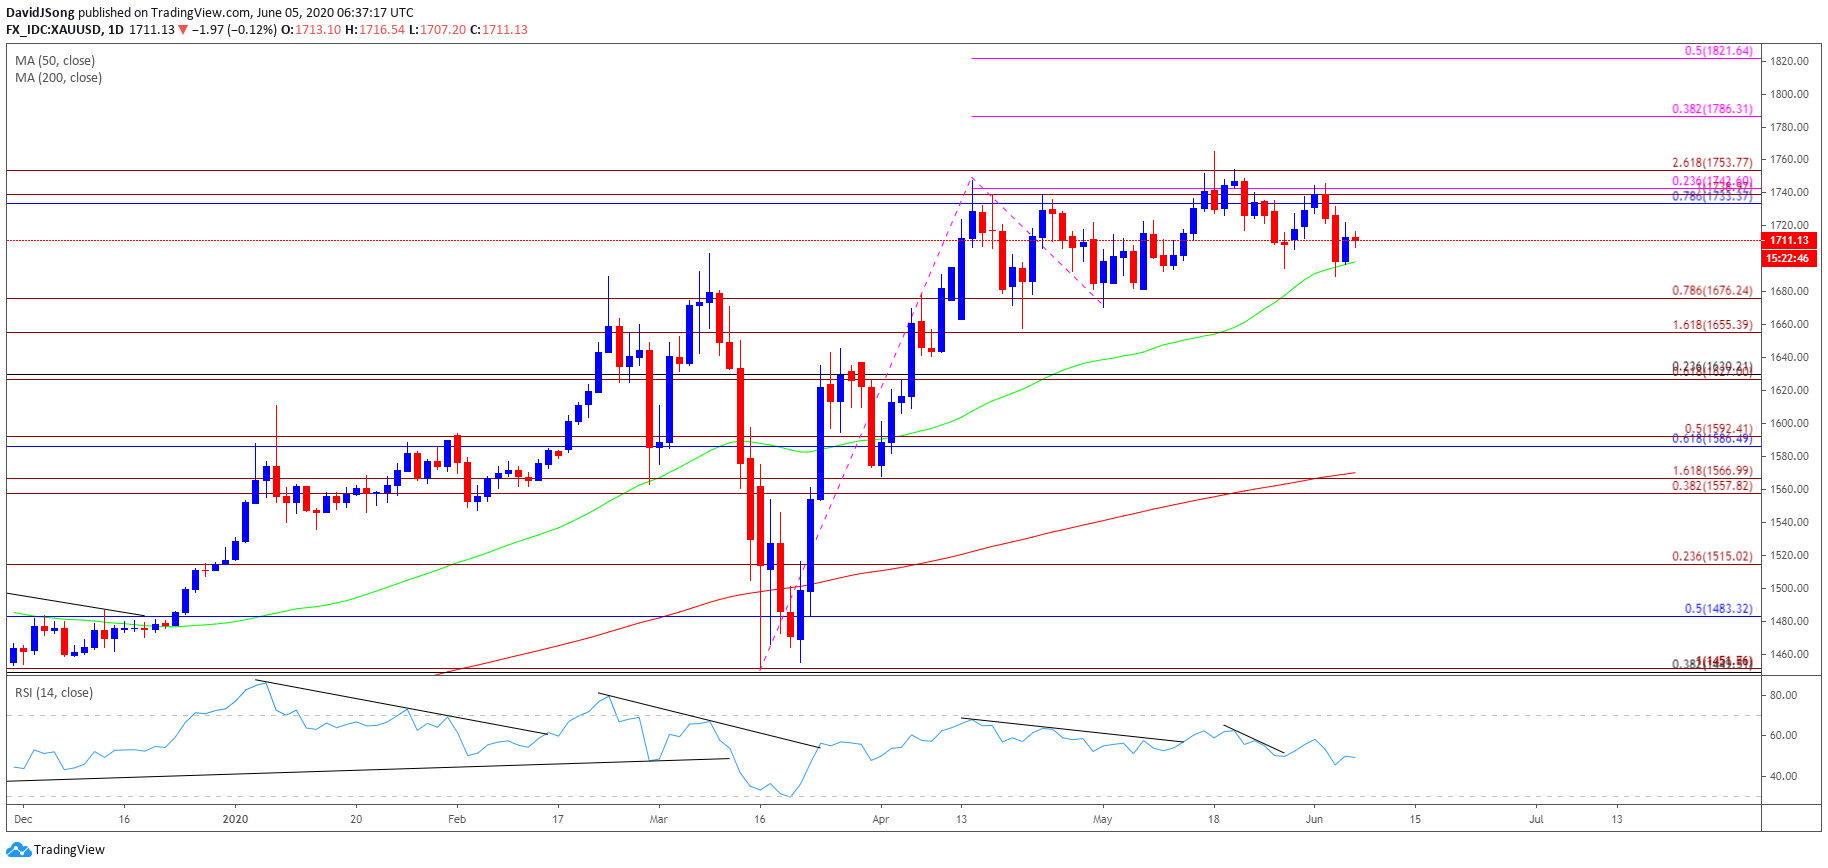
Source: Trading View
The price of gold continues to consolidate after failing to test the November 2012 high ($1754), but the ability to hold above the $1676 (78.6% expansion) region instills a constructive outlook as it largely lines up with the May low ($1670).
The Relative Strength Index (RSI) displays a similar dynamic as the indicator breaks out of the negative slope from the previous month, but need the price of gold to close above the Fibonacci overlap around $1733 (78.6% retracement) to $1743 (23.6% expansion) to bring the topside hurdles on the radar.
First area of interest comes in around $1754 (261.8% expansion), with the next region coming in around $1786 (38.2% expansion) followed by the 2012 high ($1796).
--- Written by David Song, Currency Strategist
Follow me on Twitter at @DavidJSong


