


S&P 500, FTSE 100 Analysis and News
S&P 500 | Pivotal Resistance In Focus
The grind higher in the S&P 500 has come to halt as the index moved within close vicinity to pivotal resistance at 2999, which marks the 200DMA. That said, while the S&P 500 has seen a slight pullback from its post-crash highs, the initial focus will be on the 2900 level for support. Failure to hold puts the 50% Fibonacci retracement back into play at 2790. While US-China tensions are becoming increasingly important, the S&P 500 remains very choppy with the index failing to establish a notable trend. However, with a lot of positive news priced in, risks are tilted to the downside.
| Change in | Longs | Shorts | OI |
| Daily | 1% | -1% | 0% |
| Weekly | 17% | -17% | -2% |
S&P 500 Price Chart: Daily Time Frame
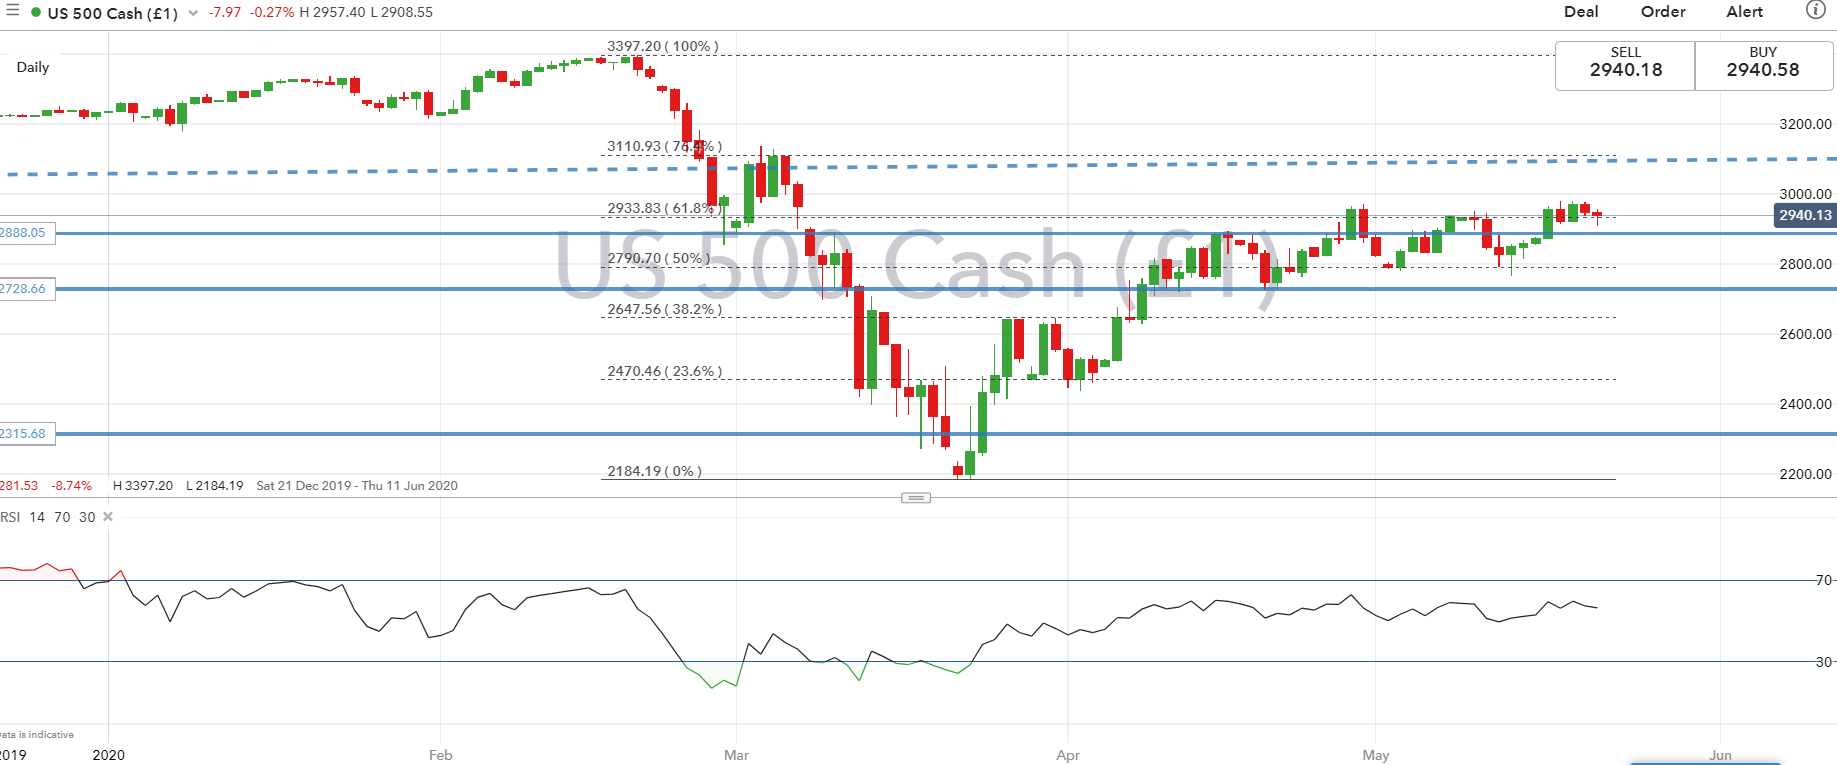
Source: IG Charts
FTSE 100 | Rangebound Trading Persists
The FTSE 100 continues to trade in rangebound fashion with the index sticking between the 38.2% and 50% Fibonacci retracement. On the topside, rises are likely to remain capped at 6110-20, which marks the weekly highs. As concerns rise over US-China relations, we see risks to the downside, raising the prospect of a test at 5800. However, key support is situated at 5500.
| Change in | Longs | Shorts | OI |
| Daily | 35% | -1% | 5% |
| Weekly | -51% | 71% | 15% |
FTSE 100 Price Chart: Daily Time Frame

Source: IG Charts
RESOURCES FOR TRADERS
Whether you are a new or experienced trader, we have several resources available to help you; indicator for tracking trader sentiment, quarterly trading forecasts, analytical and educational webinars held daily, trading guides to help you improve trading performance, and one specifically for those who are new to forex.
--- Written by Justin McQueen, Market Analyst
Follow Justin on Twitter @JMcQueenFX


