


GOLD PRICE TECHNICAL FORECAST: NEUTRAL
- Gold price rally may be losing steam on approach to $1800/oz
- Near-term positioning bolstering the case for a downturn ahead
- Any pullback seen as corrective while above the $1600/oz mark
A spirited gold rally may be running out of steam as prices approach long-standing resistance near the $1800/oz figure. Steepening negative RSI divergence suggests upside momentum is fading, which may open the door for capitulation and a reversal downward.
Broadly speaking, any reversal lower has a long way to travel before the long-term rising trend is challenged. To do that, sellers would need to force a return back below the $1600/oz figure. Looking past the inflection level at 1563.00, trend line support guiding the rise from August 2018 comes into view.

Gold price weekly chart created with TradingView
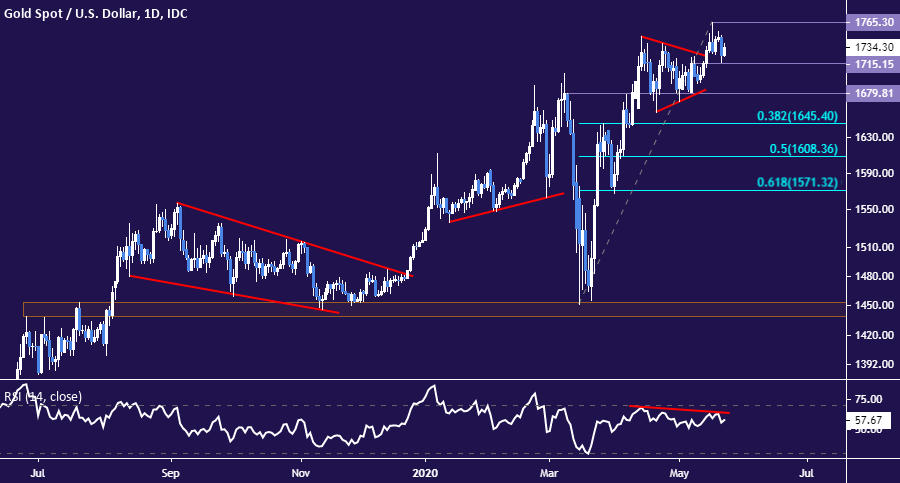
Zooming in to the daily chart, the metal is struggling to find follow-through after breaking higher out of a bullish Symmetrical Triangle chart pattern. Tellingly, negative RSI divergence speaks to ebbing buying pressure here as well.
Pushing past an initial layer of minor support at 1715.15 aims for a sturdier inflection point at 1679.81. A daily close below that may set the stage for a challenge of the 38.2% Fibonacci retracement at 1645.40. Neutralizing topping cues probably requires a close above the May swing high at 1765.30.
Gold price daily chart created with TradingView

GOLD MARKET SENTIMENT
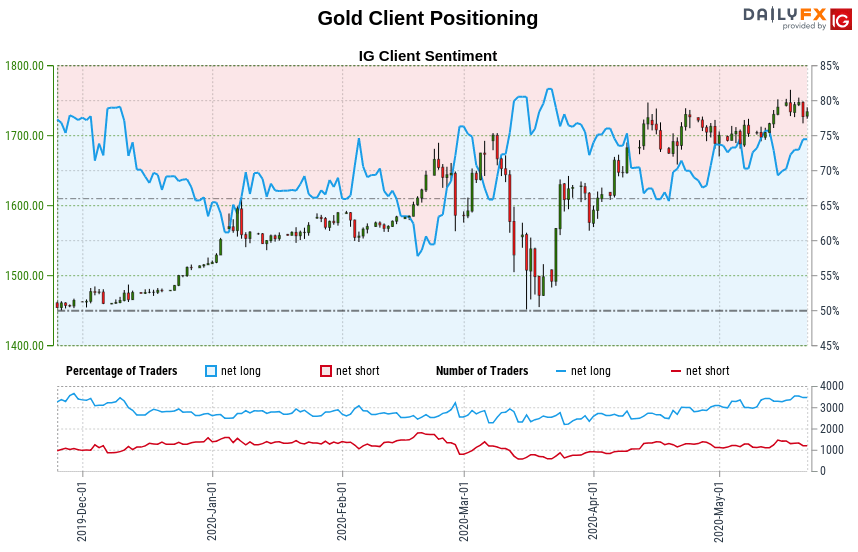
Retail positioning data adds to the case for on-coming weakness. IG Client Sentiment (IGCS) statistics reveal that 73.72 percent of traders are net-long gold, with the long-to-short ratio at 2.80 to 1. This is typically used as a contrarian indicator, so the skew in traders’ exposure suggests a bearish bias.
In fact, the net-long tilt has widened recently, up 1.22 percent compared with a week before. This seems to imply an increasing probability of on-coming reversal downward as the disparity in positioning swells to levels where sentiment extremes have often occurred previously.
See the full IGCS sentiment report here.

GOLD TRADING RESOURCES
- Just getting started? See our beginners’ guide for FX traders
- What is your trading personality? Take our quiz to find out
- Join a free webinar and have your trading questions answered
--- Written by Ilya Spivak, Head APAC Strategist, DailyFX
To contact Ilya, use the Comments section below or @IlyaSpivak on Twitter


