


Sterling (GBP) Forecasts – GBP/USD and EUR/GBP Charts and Analysis:

GBP/USD Falls Through Support and Trend Suggest More to Come
GBP/USD has fallen throughout the week as investors start to re-price the economic damage of the ongoing UK lockdown and the perhaps unsurprising news that EU/UK trade talks are going nowhere fast. A series of five lower highs and lower lows this week highlight this current weakness and with the support at 1.2166 already pierced, the outlook looks bleak for Sterling bulls. To confirm this sentiment, the pair will need to close and open below the April 6 low which would leave big figure support at 1.2100 and the 38.2% Fibonacci retracement at 1.2095 under pressure. The pair do look oversold currently with the CCI indicator showing an extreme reading not seen since March 20 when cable hit 1.1474 before rebounding sharply. Any upside progress will need to take into account the 50% Fib and 50-dma at 1.2306 and the 20-dma at 1.2375.
GBP/USD Daily Price Chart (December 2019 – May 15, 2020)

| Change in | Longs | Shorts | OI |
| Daily | 0% | -17% | -6% |
| Weekly | -1% | -4% | -2% |
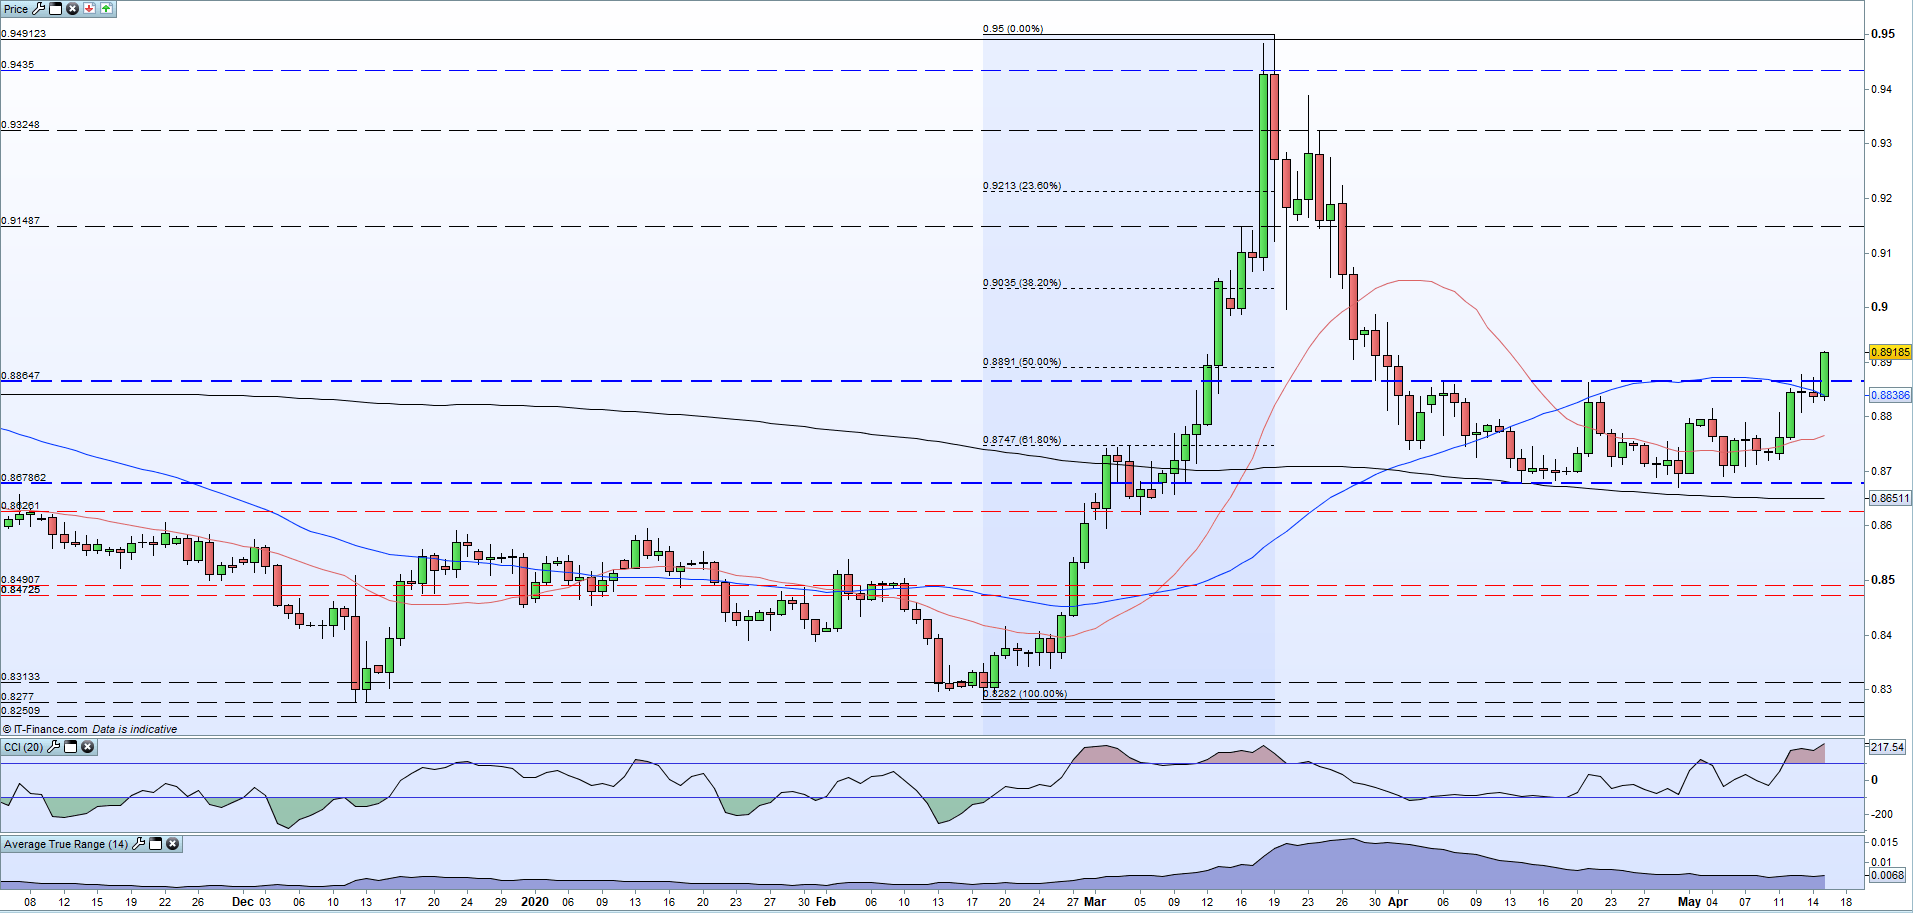
EUR/GBP – A Clean Break of Multi-week Resistance
Another major pair that highlight Sterling’s current weakness is EUR/GBP, despite the poor Euro-Zone economic news out this week. Rangebound since the start of April, EUR/GBP probed resistance on Wednesday and Thursday before making a clean break above old resistance at 0.8865 during today’s session. A close and open above this level will add more credibility to another move higher, especially with the 50-dma now broken. The 50% Fibonacci retracement level at 0.8891 should be monitored, while a cluster of old lows and the March 30 high just under 0.9000 may stem further short-term upside. The CCI is in overbought territory and while this may act as a brake on further upside, positive sentiment remains in place.
EUR/GBP Daily Price Chart (November 2019 – May 15, 2020)
| Change in | Longs | Shorts | OI |
| Daily | -29% | 23% | -10% |
| Weekly | -35% | 64% | -7% |
Traders may be interested in two of our trading guides – Traits of Successful Traders and Top Trading Lessons – while technical analysts are likely to be interested in our latest Elliott Wave Guide.
What is your view on Sterling (GBP) – bullish or bearish?? You can let us know via the form at the end of this piece or you can contact the author via Twitter @nickcawley1.


