


Gold Talking Points
The price of gold continues to consolidate after failing to test the November 2012 high ($1754), but the precious metal may attempt to break out of range bound price action as the Relative Strength Index (RSI) threatens the bearish formation carried over from the previous month.
Technical Forecast for Gold: Bullish
The price of gold appears to be stuck after trading to a fresh yearly high ($1748) in April, and the precious metal may trade within a more defined range over the days ahead as plans to restart the advanced economies help to restore investor confidence.
It remains to be seen if the unprecedented response by monetary as well as fiscal authorities will spur a V-shaped recovery as the Great Lockdown appears to have passed its peak, and shifts in trader sentiment may continue to influence the price of gold as the Federal Reserve and its major counterparts become reliant on their non-standard tools to combat the economic shock from COVID-19.
The low interest rate environment along with theballooning central bank balance sheets may continue to act as a backstop for bullion as marketparticipants look for an alternative to fiat-currencies, and the technical outlook for gold remains constructive as the 50-Day SMA and 200-Day SMA retain the positive slopes from earlier this year.
Keep in mind, the opening range for 2020 instilled a bullish outlook for the price of gold as the precious metal cleared the 2019 high ($1557), with a similar scenario materializing in February as bullion tagged a fresh yearly high ($1689)after marking the monthly low ($1548) during the first full week.
However, the monthly opening range for March was less relevant as the actions taken by major central banks fueled market volatility, with the decline from the monthly high ($1704) leading to a break of the January low ($1517).
Nevertheless, gold traded to a fresh yearly high ($1748) in April following the reaction to the former-resistance zone around $1450 (38.2% retracement) to $1452 (100% expansion), and the price for bullion may attempt to break out of its current range as the Relative Strength Index (RSI) threatens the bearish formation carried over from the previous month.
Gold Price Daily Chart
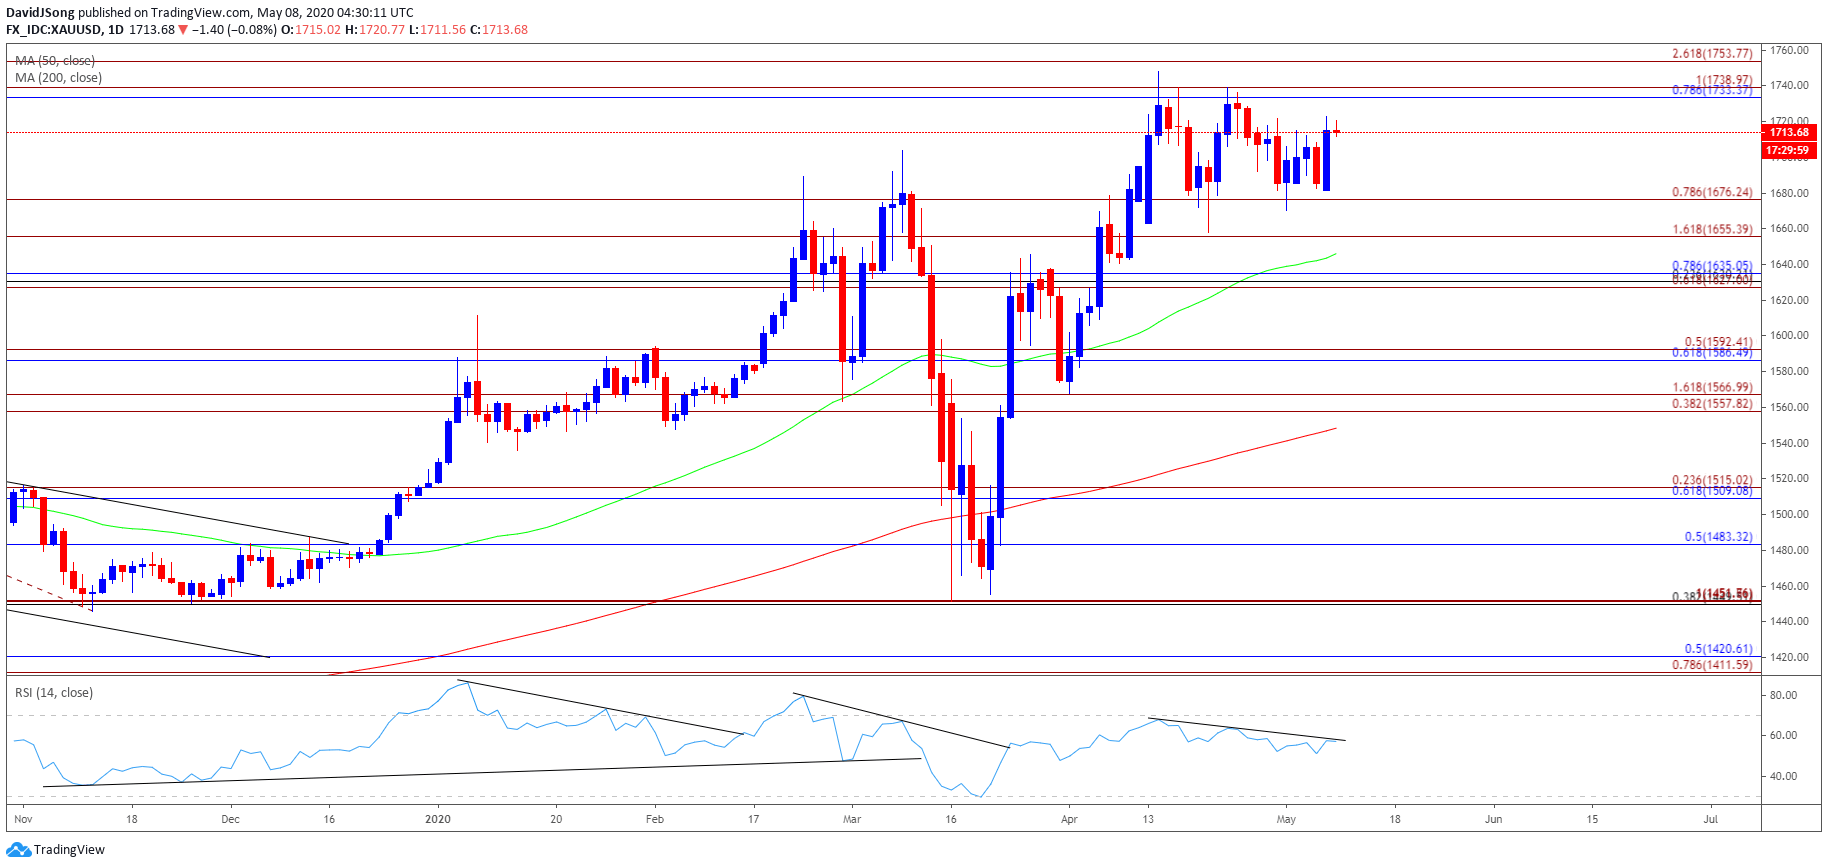
Source: Trading View
The price of gold continues to consolidate in Mayafter failing to test the November 2012 high ($1754), and precious metal may trade within a more defined range ahead amid the lack of momentum to close below the $1676 (78.6% expansion) region.
Need a break/close below $1655 (78.6% expansion) to bring the April low ($1568) on the radar, but recent developments in the RSI suggest the bearish momentum is abating as the indicator threatens the downward trend carried over from the previous month.
The RSI may offer a bullish signal if the oscillator shows a definitive break of trendline resistance, with a break/close above the Fibonacci overlap around $1733 (78.6% retracement) to $1739 (100% expansion) bringing the $1754 (261.8% expansion) region on the radar as it lines up with the November 2012 high ($1754).
--- Written by David Song, Currency Strategist
Follow me on Twitter at @DavidJSong


