


Gold Prices, XAU/USD - Technical Forecast
- Gold price consolidation continued after its bullish momentum faded
- XAU/USD facing a couple of bearish technical warning signs ahead
- Find the right trading style with the help of our new education section
Gold Technical Outlook
Gold prices spent most of this past week trading cautiously lower as the precious metal resumed consolidating since finding resistance in mid-April. This represents a notable shift in XAU/USD’s prior uptrend that took it from March’s bottom to highs from last month. Since then, gold’s behavior has shifted from predominantly bullish to neutral, particularly as rising support was broken – red line on the daily chart below.
There are some bearish technical warning signs undermining the case for uptrend resumption. An Evening Star candlestick pattern emerged towards the end of April and has since seen cautious downside follow-through. Yet at the same time, the next critical barrier of support held around 1678. Taking this price out could pave the way for a reversal in the week ahead. Otherwise more sideways price action could be in store next.
Gold Daily Chart

Gold Chart Created in TradingView
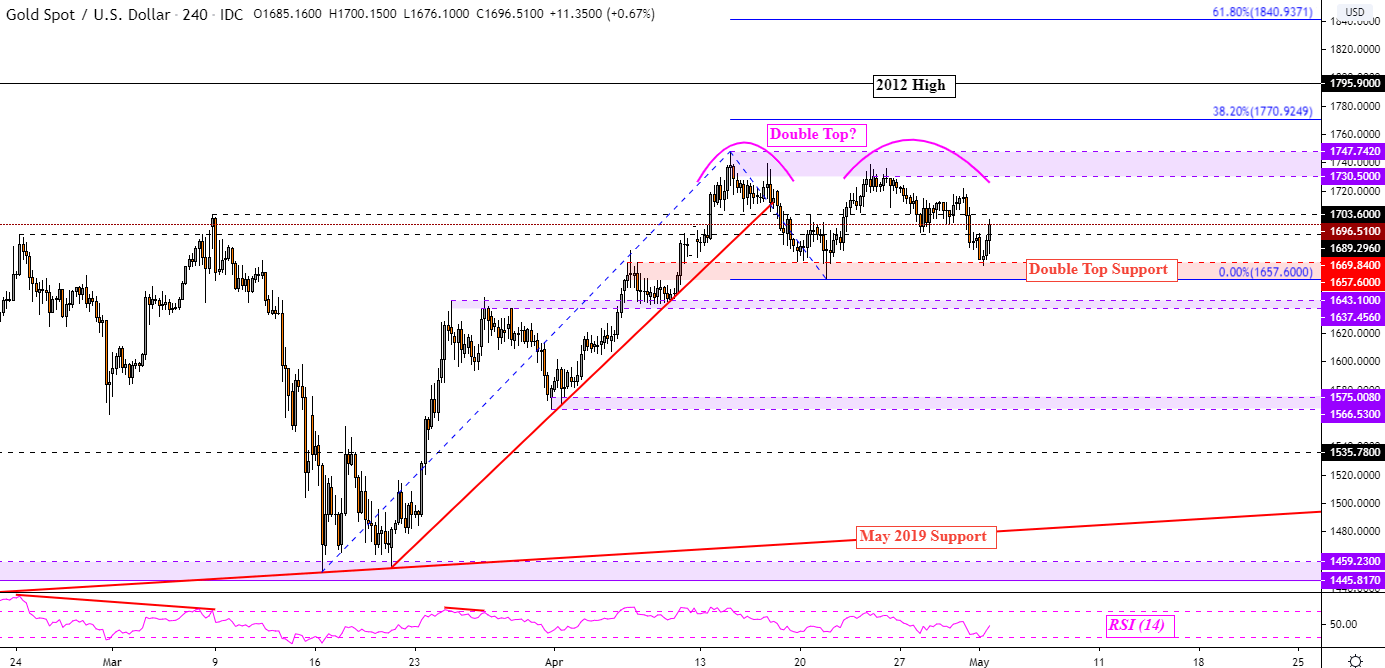
Zooming in on the 4-hour chart reveals a closer look into what seems to be a Double Top in the formation. This is a bearish chart pattern where two peaks – with a pullback in-between – precede a reversal of the prior uptrend. Support held between 1657 – 1669 which could pave the way for a bounce to resistance (1760 – 1747). Such an outcome may even open the door for a Triple Top, another bearish chart pattern.
Taking out Double Top support could confirm the formation and pave the way for a reversal. So far, this is lacking. In the event of a drop ahead, keep an eye on the inflection point between 1637 – 1643. If this area is taken out, that could open the door to revisiting lows from the beginning of April (1566 – 1575). Otherwise, surpassing Double Top resistance exposes the 2012 high at 1795.
| Change in | Longs | Shorts | OI |
| Daily | 8% | 0% | 4% |
| Weekly | 5% | -11% | -3% |
XAU/USD 4-Hour Chart
Gold Chart Created in TradingView
--- Written by Daniel Dubrovsky, Currency Analyst for DailyFX.com
To contact Daniel, use the comments section below or @ddubrovskyFX on Twitter


