


GBP/USD Price Technical Analysis
GBP/USD- Paused Uptrend Move
On April 10, GBP/USD printed its highest level in four weeks at 1.2487 then retreated after, as some bulls seemed to cut back. Yet, the weekly candlestick closed in the green with 1.5% gain.
This week, the Relative Strength Index (RSI) remained flat above 50, highlighting the lack of impulse to push the price higher.
GBP/USD DAILY PRICE CHART (July 14, 2018 – April 17, 2020) Zoomed out


GBP/USD DAILY PRICE CHART (JAN 30– April 17, 2020) Zoomed IN
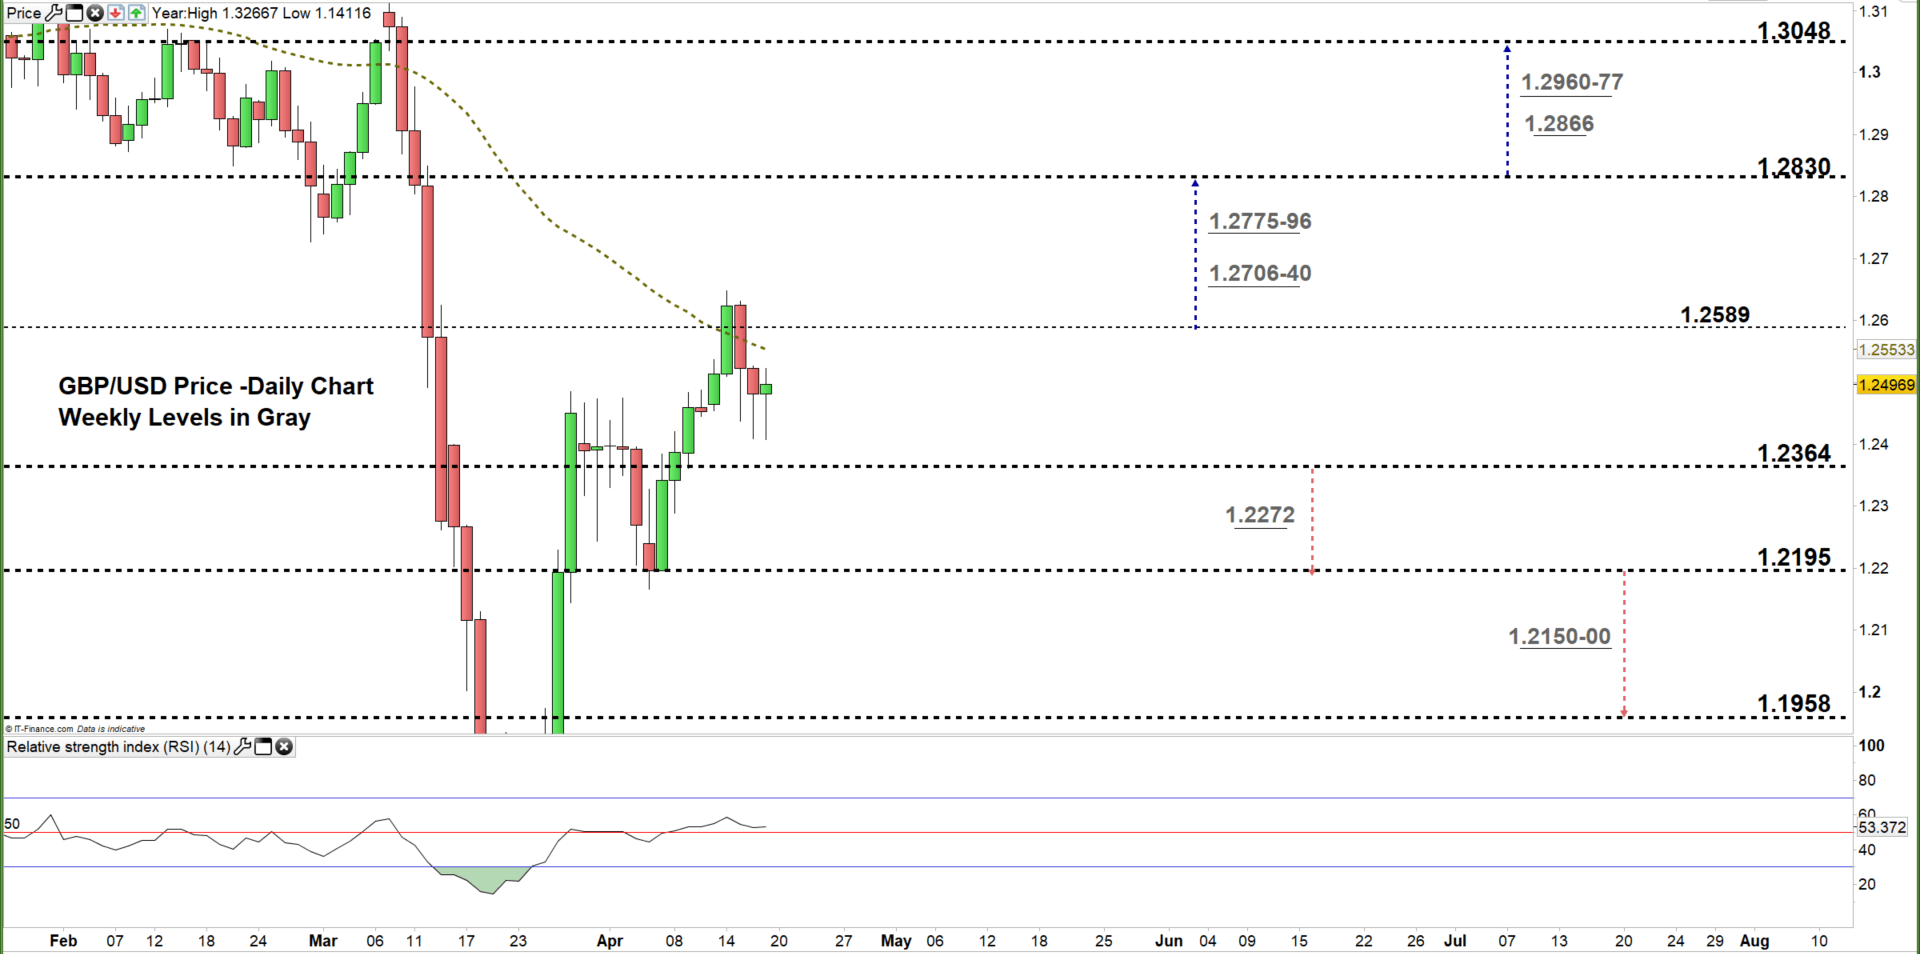
From the daily chart, we noticed on Tuesday GBP/USD rallied to 1.2647 – its highest level in nearly five weeks. In the following day, the price U-turned reflecting bull’s reluctance to push the price further. This led the market to decline to current trading zone 1.2364 – 1.2589. Additionally, the market closed below the 50-day average, generating a bearish signal.
A close below the low end of the zone opens the door for a bearish comeback and possibly send GBPUSD towards 1.2195. Further close below that level may encourage bears to press the market towards 1.1958. That said, the weekly support levels underlined on the chart (zoomed in) should be considered.
On the other hand, any close above the high end of the zone may cause a rally towards 1.2830. Further close above that level could extend this rally towards 1.3048. In that scenario, the weekly resistance area and level marked on the chart should be watched closely.

GBP/USD Four Hour PRICE CHART (Mar 25 – April 17, 2020)
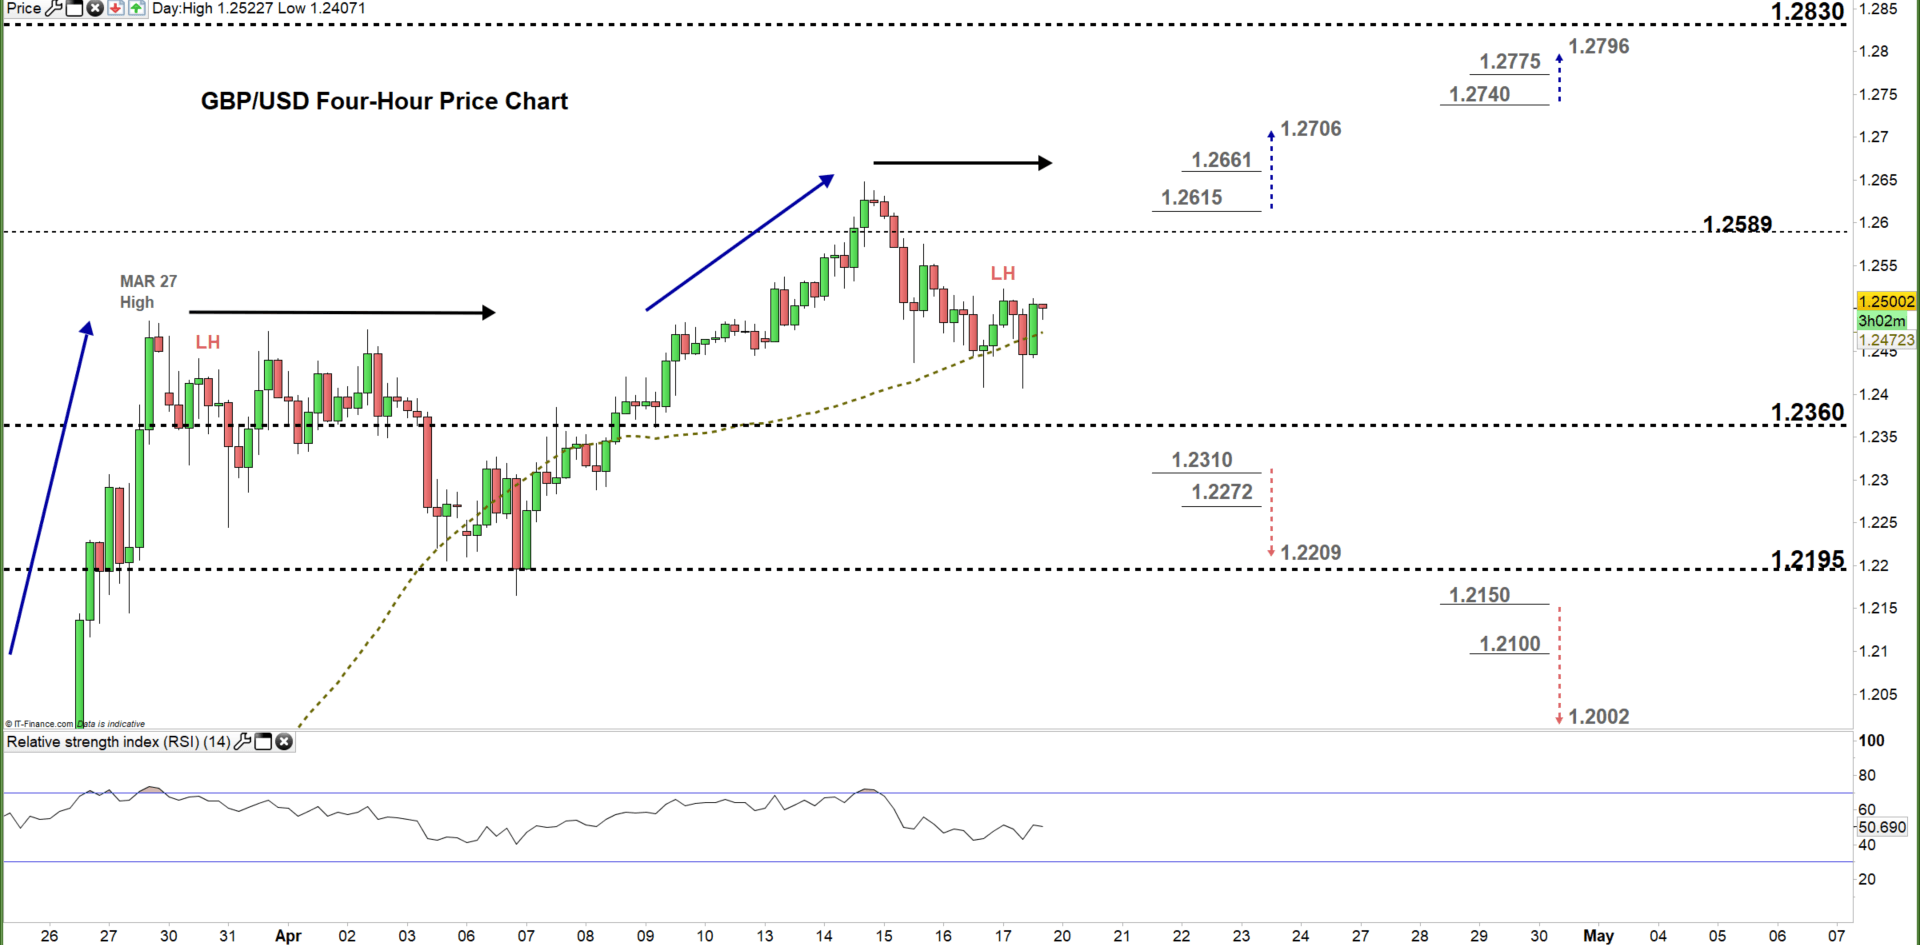
Looking at the four-hour chart, we noticed that on Friday GBP/USD resumed bullish price action as broke above the March 27 high at 1.2485. However, today the pair corrected its uptrend move and carved out a lower high at 1.2522.
A break below 1.2310 would be considered a bearish signal. This could send GBPUSD towards 1.2209. Although, the weekly support level underscored on the chart should be kept in focus. In turn, any break in the other direction i.e. above 1.2615 may start a rally towards 1.2706. Nevertheless, the resistance level at 1.2661 would be worth monitoring.
See the chart to find out more about key levels Cable would encounter in a further bearish /bullish scenario.

Written By: Mahmoud Alkudsi
Please feel free to contact me on Twitter: @Malkudsi


