


EUR/USD Technical Analysis
EUR/USD – Edged Higher
Last week, more bears eased up causing EUR/USD to rally further. On Friday, the price surged to 1.1147 then closed the weekly candlestick in the green with 4.0% gain.
This week, the Relative Strength Index (RSI) crossed below 50, highlighting a possible start of downtrend momentum.
EUR/USD Daily Price Chart (Nov 3, 2019 – APril 3, 2020) Zoomed Out


EUR/USD Daily Price Chart (JAN 20– April 3, 2020) Zoomed in

Looking at the daily chart, we noticed that on Monday EUR/USD U-turned before testing the high end of current trading zone 1.0822 -1.1241, indicating that bears were not done yet. Later on, the price closed below the 50-day average, generating another bearish signal.
Thus, a close below the low end of the zone may encourage bears to press EURUSD towards 1.0498. Further close below that level may send the price even lower towards 0.9989. In that scenario, the weekly support levels underscored on the chart (zoomed in) should be considered.
In turn, any failure in closing below the low end of the zone reflects bears hesitation. This could reverse the pair’s direction towards the high end of the zone. Further close above 1.1300 handle could extend the rally towards 1.1639. That said, the daily and weekly resistance levels and area marked on the chart should be kept in focus.

EUR/USD Four Hour Price Chart (MAR 10 – April 3, 2020)
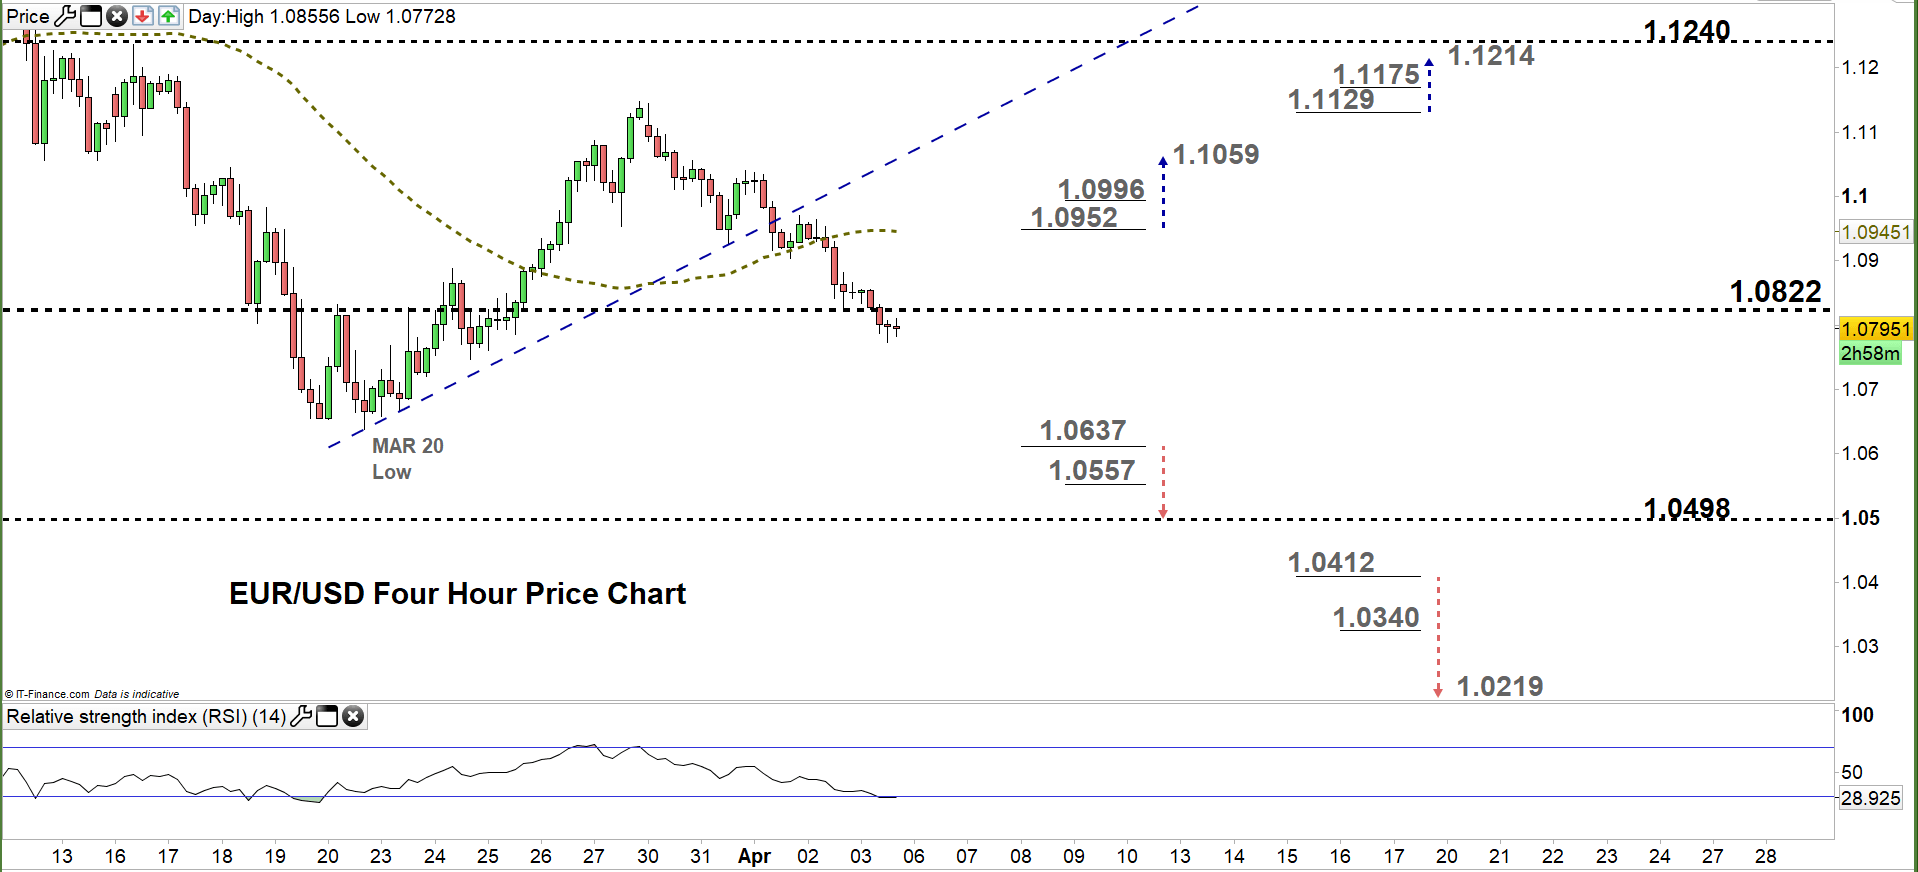
From the four-hour chart, we noticed that on Wednesday EUR/USD broke below the uptrend line originated from the March 20 low at 1.0637, then started a downtrend move creating lower high with a lower low.
A break below 1.0637 could send EURUSD towards 1.0498. Although, the weekly support level underlined on the chart should be watched closely. Any break in the other direction i.e. above 1.0952 may cause a rally towards 1.1059. Yet, the daily resistance level printed on the chart would be worth monitoring.
See the chart to know more about key technical levels in a further bullish/bearish scenario.

Written By: Mahmoud Alkudsi
Please feel free to contact me on Twitter: @Malkudsi


