Crude Oil Price Talking Points
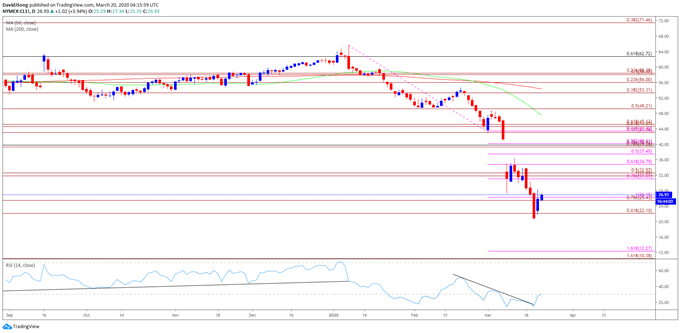
The price of oil bounces back from a fresh yearly low ($20.52) and crude may stage a larger recovery over the coming days as the Relative Strength Index (RSI) is on the cusp of flashing a textbook buy signal.
Technical Forecast for Crude Oil: Neutral
The broader outlook for crude is encompassed with bearish indications as a ‘death-cross’ formation materialized in late February, with the 50-Day SMA ($47.57) crossing below the 200-Day SMA ($54.38).
The negative slope in the simple moving averagescast a bearish outlook for crude, with the recent series of lower highs and low in the price of oil triggering a break of the 2016 low ($26.05).
Oil Daily Chart

Source: Trading View
However, the recent series of lower highs and lows unravels as the price of oil bounces back from a fresh yearly low ($20.52), and crude may stage a larger rebound over the coming days as the bearish momentum appears to be abating.
Recent developments in the Relative Strength Index (RSI) raises the scope for a larger rebound in oil prices as the indictor breaks out of the bearish formation carried over from the previous month, with the oscillator on the cusp of flashing a textbook buy signal as it bounces back from oversold territory.
The move above the Fibonacci overlap around $25.40 (78.6% expansion) to $26.20 (100% expansion) brings the $31.00 (78.6% expansion) to $32.50 (50% expansion) region on radar, with the next area of interest coming in around $34.80 (61.8% expansion).
It remains to be seen if crude will fill the price gap from earlier this month amid the string of failed attempts to close above the $34.80 (61.8% expansion) region, with oil prices at risk of facing range bound conditions as the broader outlook is encompassed with bearish indications.
Sign up and join DailyFX Currency Strategist David Song LIVE for an opportunity to discuss key themes and potential trade setups.
--- Written by David Song, Currency Strategist
Follow me on Twitter at @DavidJSong.


