


US DOLLAR TECHNICAL FORECAST: BULLISH
- US Dollar soars vs majors, posts biggest one-week rise since October 2008
- Break of double top resistance, Flag pattern break hints rally may continue
- Negative RSI divergence warns against over-extrapolating near-term gains
The US Dollar roared higher, scoring the largest weekly rise since October 2008 – the height of the global financial crisis – against an average of its major currency counterparts (EUR, JPY, GBP, AUD). The rally pushed from a confluence of support marked by a rising trend line defining the structural uptrend from June 2014 and a nearer-term barrier in play since mid-September 2018.
The benchmark unit has now overcome double top resistance capping gains since December 2016, which seemingly sets the stage for upside follow-through. A bullish Flag pattern carved out in the fourth quarter of last year may offer a crude upside target. Measuring the rise from the January 2018 low through the September 2019 high as the setup’s “flagpole” and extrapolating it upward tellingly lands at the 100% Fibonacci expansion. A rally there would amount to an 8-9 percent appreciation from current levels.
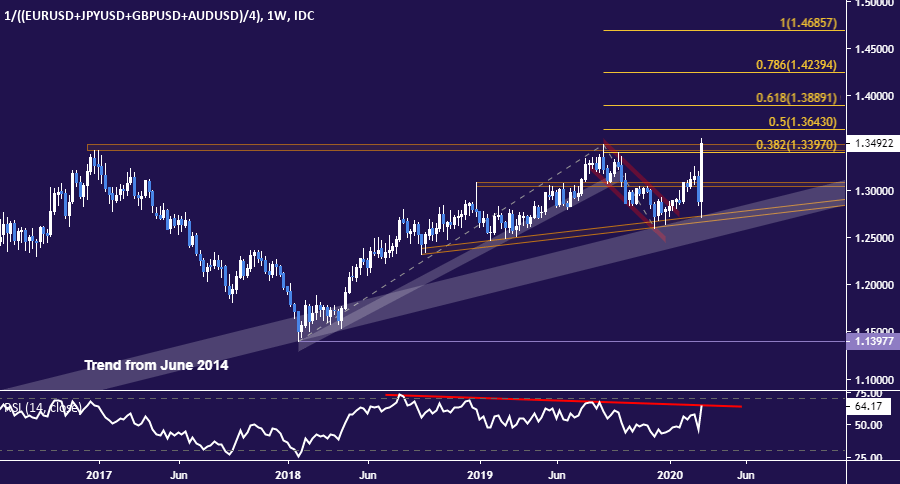
US Dollar weekly chart created with TradingView
Traders might proceed with caution however considering the latest upswing is yet to neutralize signs of acute RSI divergence. The oscillator is not setting higher highs even as prices are, which warns of ebbing capacity for upward progress and might precede either a period of sideways congestion or a pullback. Securing a foothold below the trend line from 2014 on a closing basis seems like a prerequisite to make the case for a lasting downturn however.
--- Written by Ilya Spivak, Sr. Currency Strategist for DailyFX.com
To contact Ilya, use the comments section below or @IlyaSpivak on Twitter
US Dollar TRADING RESOURCES
- Just getting started? See our beginners’ guide for FX traders
- Having trouble with your strategy? Here’s the #1 mistake that traders make
- Join a free live webinar and have your trading questions answered


