


Japanese Yen, USD/JPY, EUR/JPY, AUD/JPY, CAD/JPY - Talking Points
- Japanese Yen appreciation extends, upside momentum appears to be at risk
- USD/JPY, EUR/JPY approaching key psychological barriers into next week
- AUD/JPY and CAD/JPY are already testing potential downside breakouts
Japanese Yen Technical Outlook
The anti-risk Japanese Yen experienced another solid week, extending its broad advance since the end of February. Taking a look at my majors-based Yen index – which averages it against USD, AUD, GBP and EUR – the currency is generally at its most expensive since October. Negative RSI divergence is now present however, hinting fading upside momentum. That may precede a turn lower under rising support from February. But, the dominant uptrend may hold looking at the rising trend line from 2018 on the chart below.

Majors-Based Yen Index

Yen Index Chart Created in TradingView
USD/JPY Outlook
USD/JPY has extended its top off highs from 2019 after prices took out rising support from August. Now, the pair is aiming to test the trough from last year which also coincides with the bottom in 2018. This makes for a psychological barrier between 104.45 to 105.05. If the latter is taken out, the would expose lows from 2016. Maintaining the downtrend is falling resistance from February – pink line on the chart below.
| Change in | Longs | Shorts | OI |
| Daily | 7% | 0% | 1% |
| Weekly | 1% | 3% | 2% |
USD/JPY Daily Chart
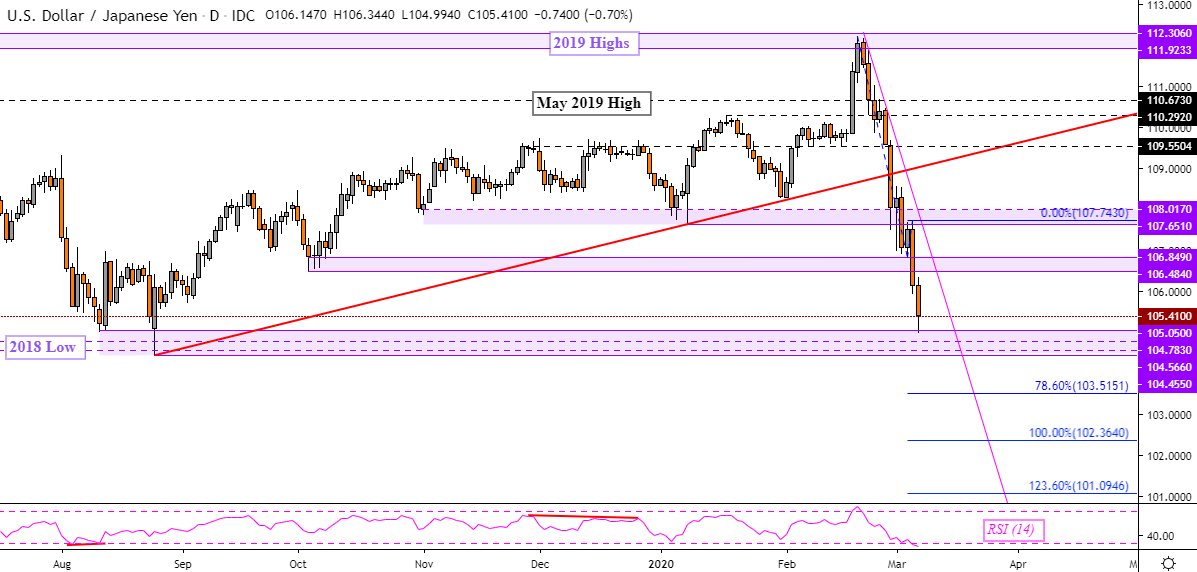
USD/JPY Chart Created in TradingView
EUR/JPY Outlook
EUR/JPY also made downside progress, though its performance has been more tepid thanks to broad Euro strength. For the pair to resume the downtrend from January, prices need to clear key support between 118.09 to 118.55. That would expose the October low at 117.07 on the way to last year’s low. In the event of a rise, falling resistance from January may maintain the downward technical bias – red lines on the chart below.
EUR/JPY Daily Chart

EUR/JPY Chart Created in TradingView
AUD/JPY Outlook
AUD/JPY may be on the verge of confirming a downside breakout through lows from last year. That is the psychological barrier between 69.97 to 70.66. Positive RSI divergence is present however, showing fading downside momentum. That may foreshadow a turn higher which underscores the importance of seeing downside follow-through. A daily close under the 123.60% Fibonacci extension at 69.36 exposes 68.76 on the path towards lows from 2009. A turn higher places the focus on 71.22 followed by 71.92.
AUD/JPY Daily Chart
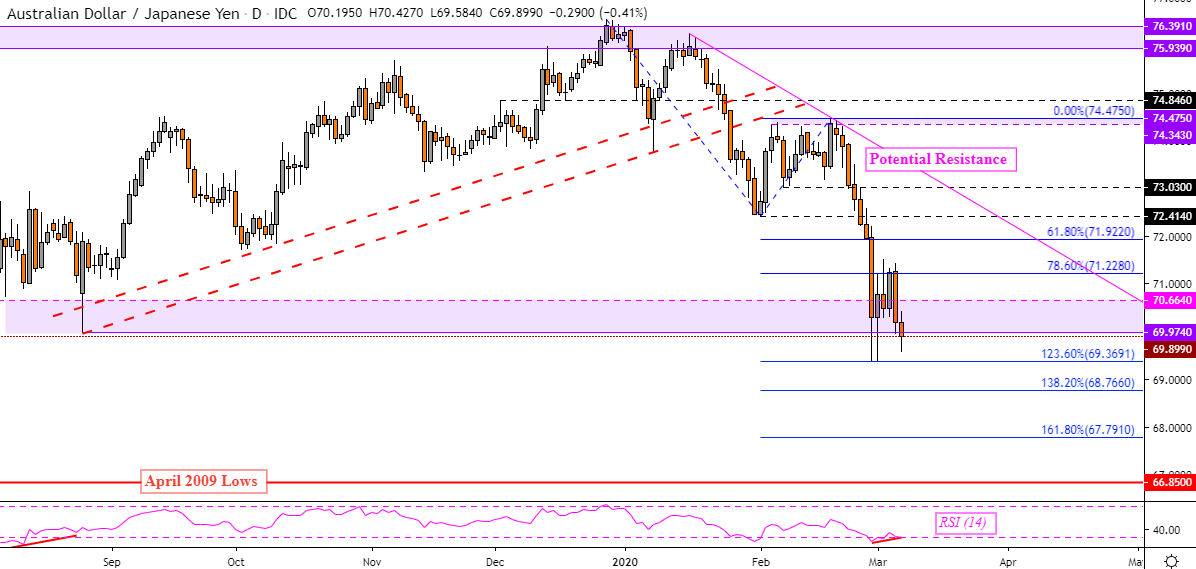
AUD/JPY Chart Created in TradingView
CAD/JPY Outlook
CAD/JPY extended the near-term downtrend from February as prices paused their descent at lows from August. That is the psychological barrier between 78.51 to 79.01. A daily close under the latter may pave the way to revisit the low seen in 2019 at 76.61. Losses are being maintained by the falling trend line from last month – pink line below. A turn higher may see prices get stuck at support-turned-resistance at 79.82 – 80.12.
CAD/JPY Daily Chart
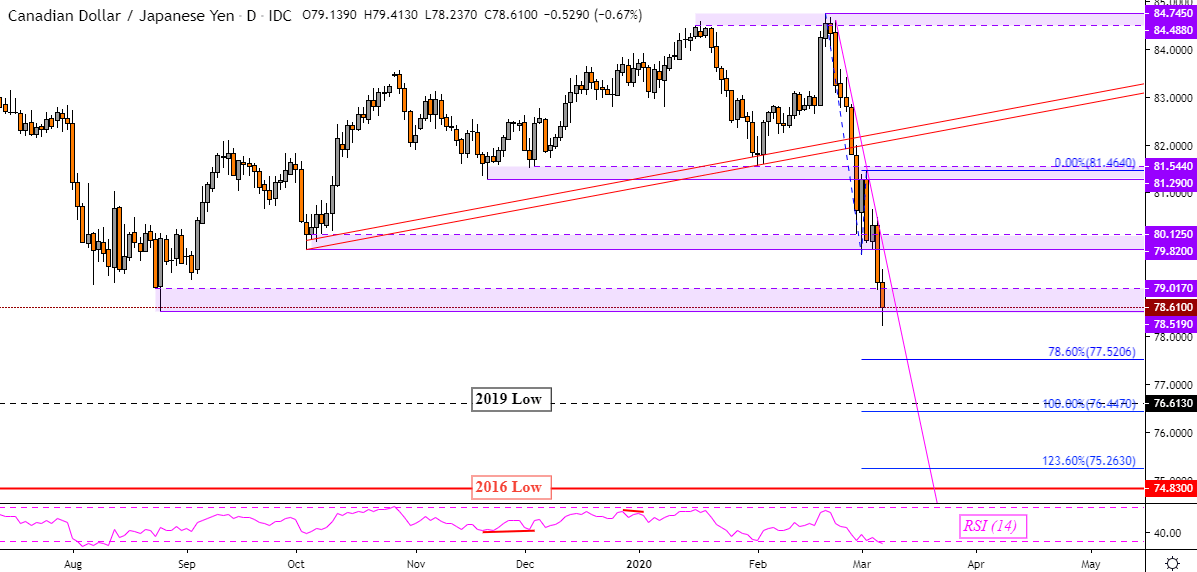
CAD/JPY Chart Created in TradingView
--- Written by Daniel Dubrovsky, Currency Analyst for DailyFX.com
To contact Daniel, use the comments section below or @ddubrovskyFX on Twitter


