US Dollar Talking Points
The US Dollar index (DXY) trades at its highest level since 2017 and the bullish price action may persist over the remainder of the month as long as the Relative Strength Index (RSI) holds in overbought territory.
Technical Forecast for US Dollar: Bullish
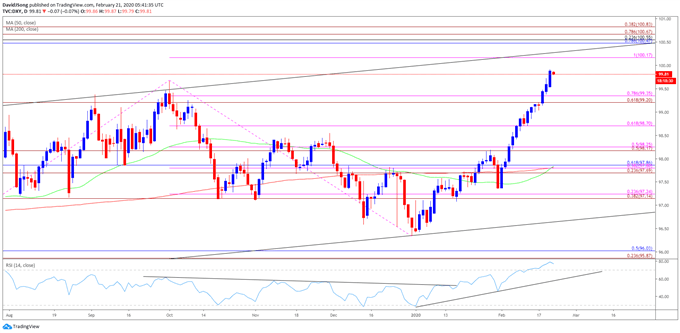
The technical outlook for the US Dollar remains constructive as the DXY clears the 2019 high (99.67), and the greenback may continue to appreciate against its major counterparts as the RSI pushes above 70 for the first time since 2018.
The extreme reading in the RSI suggests the bullish momentum will persist as the indicator tracks the upward trend from earlier this year, and the US Dollar may continue to exhibit a bullish behavior until the oscillator falls back from overbought territory.
Keep in mind, the monthly opening range has been a key dynamic for DXYthroughout the fourth quarter of 2019 as the indexregistered a major high on October 1, with the monthly low for November occurring during the first full week, while the high for December happened on the first trading day of the month. The behavior has carried into 2020, and the bullish USD price action may persist during the last full week of February as the greenback extends the advance from the start of the month.
With that said, the DXY may continue to trade to fresh 2020 highs as long as the RSI holds above 70 and sits in overbought territory.
DXY Daily Chart

Source: Trading View
The technical outlook for the DXY remains constructive following the break above the 2019 high (99.67) and the bullish USDollar price action may carry into the last full week of February amid the extreme reading in the RSI.
The break/close above the Fibonacci overlap around 99.20 (61.8% expansion) to 99.40 (78.6% expansion) opening up the 100.10 (100% expansion) region, with the next area of interest coming in around 100.50 (78.6% retracement) to 100.80 (38.2% expansion).
Will keep a close eye on the RSI ahead of March, with a move below 70 raising the scope for a near-term pullback in the greenback as the bullish momentum abates.
--- Written by David Song, Currency Strategist
Follow me on Twitter at @DavidJSong


