


POUND STERLING FORECAST: GBP/USD, GBP/JPY, EUR/GBP CHARTS & TECHNICAL TRADE LEVELS
- GBP/USD churns steadily lower as the Pound Sterling succumbs to broader US Dollar strength, but the cable could soon find technical support
- GBP/JPY tests year-to-date highs and possesses topside breakout potential if the Pound Sterling can surmount a nearside technical obstacle
- EUR/GBP price action hovers slightly above a critical level of confluence that stretches back over three years as the UK and EU wrestle over ongoing Brexit negotiations
The Pound Sterling remains 2.25% lower on balance from its latest swing high printed a little over two months ago subsequent to the UK General Election results that teed up a Brexit deal breakthrough.
GBP performance is roughly flat on the year, however, according to an equally-weighted index of the British Pound relative to the USD, JPY and EUR.

Lack of conviction is widely attributable to a confluence of conflicting fundamental developments that have juxtaposed the direction of GBP price action. Yet, the technical landscape may provide valuable insight on where the Pound Sterling might head next.
GBP/USD PRICE CHART: DAILY TIME FRAME (SEPTEMBER 2019 TO FEBRUARY 2020)
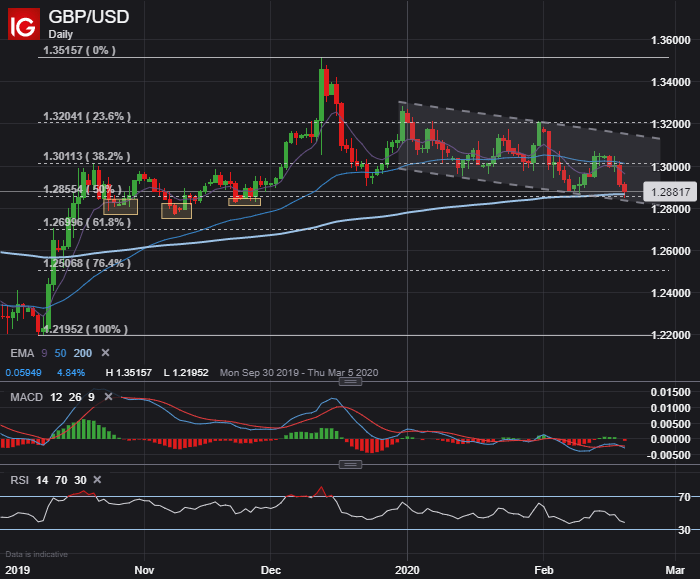
A series of lower highs and lower lows recorded by spot GBP/USD since early January seems to have developed a bullish flag.
This chart pattern is generally indicative of price consolidation, which follows the likely unwinding of bullish British Pound bets as traders reel in post-Brexit deal optimism amid broader US Dollar dominance.
After bleeding into the 1.28 handle, GBP/USD price action now gravitates around its 200-day exponential moving average.
| Change in | Longs | Shorts | OI |
| Daily | -14% | 3% | -7% |
| Weekly | -18% | 23% | -4% |
This key technical level, which could provide support to the Pound Sterling, is also underpinned by the halfway mark of the near-vertical rally recorded late last year.
Breaching this technical barrier could open up the door for British Pound bears to target the November 2019 lows while a possible rebound attempt might lose moment near the 1.3000 zone.
GBP/JPY PRICE CHART: DAILY TIME FRAME (NOVEMBER 2019 TO FEBRUARY 2020)
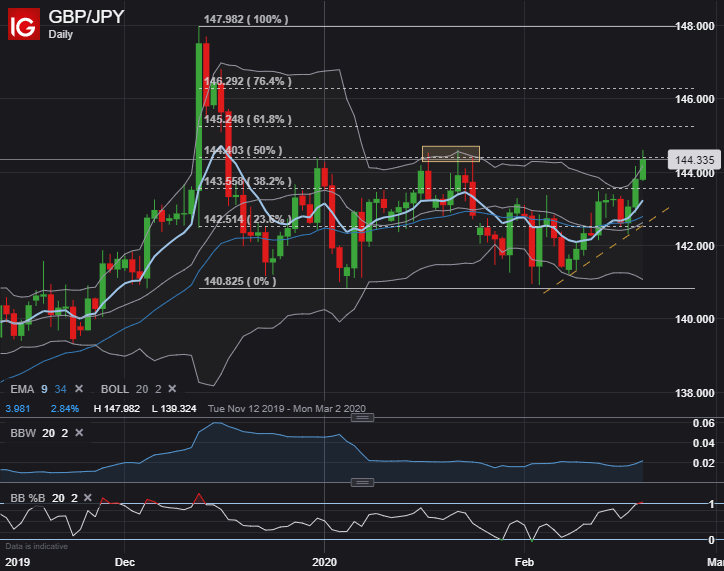
Spot GBP/JPY price action is pressing year-to-date highs in light of widespread Japanese Yen weakness.
The recent spike seems driven predominantly by mounting calls for the Bank of Japan to counter economic fallout from the novel coronavirus outbreak via looser monetary policy.
While there is potential for the Pound Sterling to notch a topside breakout, prudent traders might stay sidelined until confirmation is provided from a close above the January 22 swing high printed by spot GBP/JPY.
| Change in | Longs | Shorts | OI |
| Daily | -12% | 0% | -3% |
| Weekly | -17% | 2% | -3% |
Nevertheless, a Bollinger Band ™ expansion could facilitate a protracted climb in spot GBP/JPY and help the prices eclipse the 144.50 area.
The 61.8% Fibonacci retracement of the December 12 to January 05 selloff comes into focus as the next possible level of technical resistance whereas technical support likely resides around the 38.2% Fib and 9-day EMA.
EUR/GBP PRICE CHART: DAILY TIME FRAME (AUGUST 2019 TO FEBRUARY 2020)

A steep downtrend has dominated EUR/GBP price action since August 2019 as the Euro takes a nosedive relative to the British Pound and other major currency pairs.
EUR/GBP is currently trading modestly above the 0.83 handle – a major zone of technical confluence highlighted by the December 2016, April 2017 and December 2019 lows.
| Change in | Longs | Shorts | OI |
| Daily | 33% | -26% | 4% |
| Weekly | 6% | 4% | 5% |
The impending MACD crossover and recent jump in the RSI out of ‘oversold territory’ might be viewed as constructive technical developments that may precede a larger recovery in spot EUR/GBP.
Although, the 34-day exponential moving average underscores the broader downtrend, which could keep pressuring EUR/GBP price action lower.
-- Written by Rich Dvorak, Junior Analyst for DailyFX.com
Connect with @RichDvorakFX on Twitter for real-time market insight


