


Indices Highlights:
- Dow Jones notches new record, but can it hold?
- Nasdaq 100 the leader until it’s not
- DAX having trouble around record highs
Dow Jones notches new record, but can it hold?
U.S. indices bounced back hard last week as fear of the growth impact from the coronavirus subsided, pushing the Dow to a new record high. But can it hold? At this juncture, have to give the benefit of the doubt to the upside as there is still little evidence that stocks want to go lower. With that said, a pullback with another higher low is a more desirable set-up than chasing to new highs. Even if it weren’t a pullback per-se, but even a congestion pattern, it could offer up a chance for traders to enter long with decent risk/reward. As far as levels go, we are in uncharted territory, the 30k-mark psychological level might be next up as ‘resistance’.

Dow Jones Daily Chart (benefit of doubt to the upside)
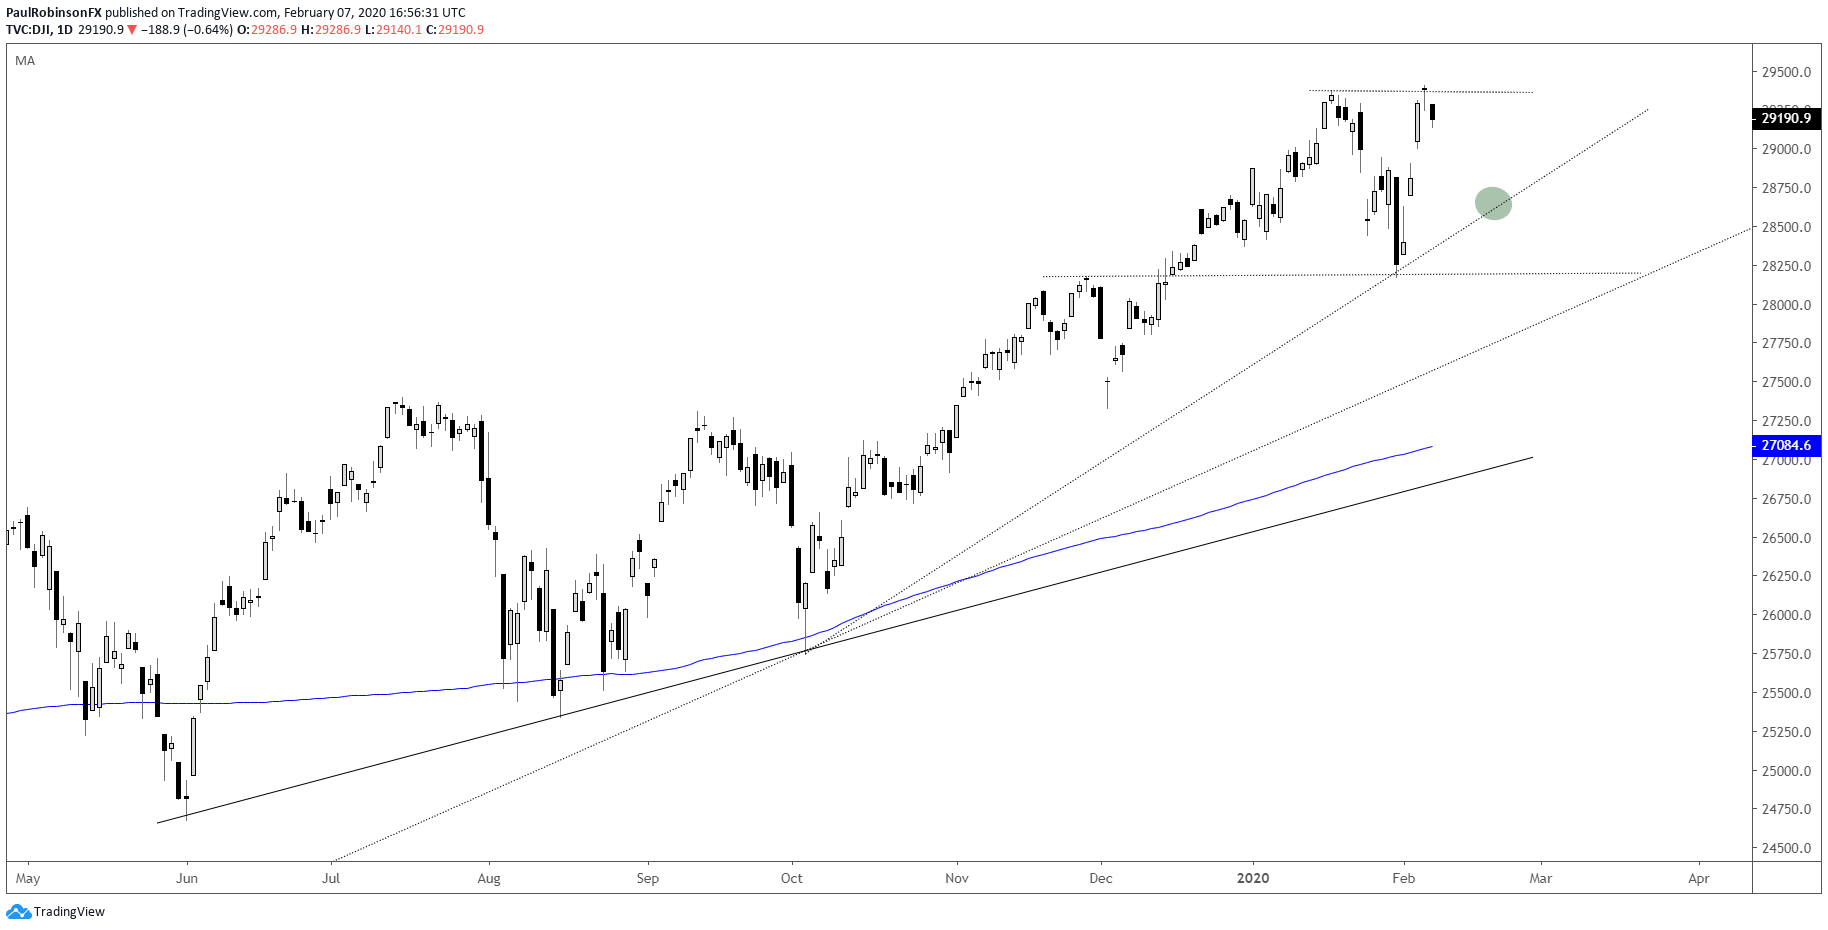
Dow Jones Chart by TradingView
Nasdaq 100 the leader until its not
The Nasdaq 100 continues to be out in front and leading the pack. It’s had some of its biggest, actually the world’s largest companies (Amazon, Apple, Google, Microsoft) perform well on earnings announcements. This has propelled the top-heavy index to the top. It’s looking to break free from the top of a channel since October. A pullback first would be desirable for initiating longs with better risk/reward than what we are seeing now.
Looking at a long-term weekly log chart, the NDX is quickly approaching the top of a channel in place since not long after the low in 2009. It only needs to go another 200 or so points to reach it. It will be interesting to see how price action plays out should we soon see it (next week?), as it was the spot the NDX stopped at in 2018 before a couple of strong dives took hold.
Nasdaq 100 Daily Chart (leading the way)

Nasdaq 100 Chart by TradingView
Nasdaq 100Weekly Chart (log) (Upper parallel the stop?)
DAX having trouble around record highs
The DAX is trying to muster the strength needed to break through record highs and hold there. It broke the 2018 high on Jan 22 on an intra-day basis, but failed to close above. A close above 13640 should have the DAX picking up a bit more momentum. A pullback first with a higher low in the range could help provide the power needed for a sustained breakout.
DAX Daily Chart (struggling around record highs)

Forex & CFD Trader Resources
Whether you are a new or experienced trader, we have several resources available to help you; indicator for tracking trader sentiment, quarterly trading forecasts, analytical and educational webinars held daily, trading guides to help you improve trading performance, and one specifically for those who are new to forex.
---Written by Paul Robinson, Market Analyst
You can follow Paul on Twitter at @PaulRobinsonFX


