


Gold Price - XAU/USD Technical Outlook
XAU/USD Price – Bulls Slow Down
On Friday, Gold surged to its highest level in over three weeks at $1,590, then closed the weekly candlestick with 1.1% gain. However, the market retreated this week as some longs seemed to cut back.
The Relative Strength Index (RSI) remained flat above 50 highlighting stalled bullish momentum.
Gold DAILY PRICE CHART (MaY 31, 2018 – FEB 7, 2020) Zoomed out

Gold DAILY PRICE CHART (July 31 – FEB 7, 2020) Zoomed In

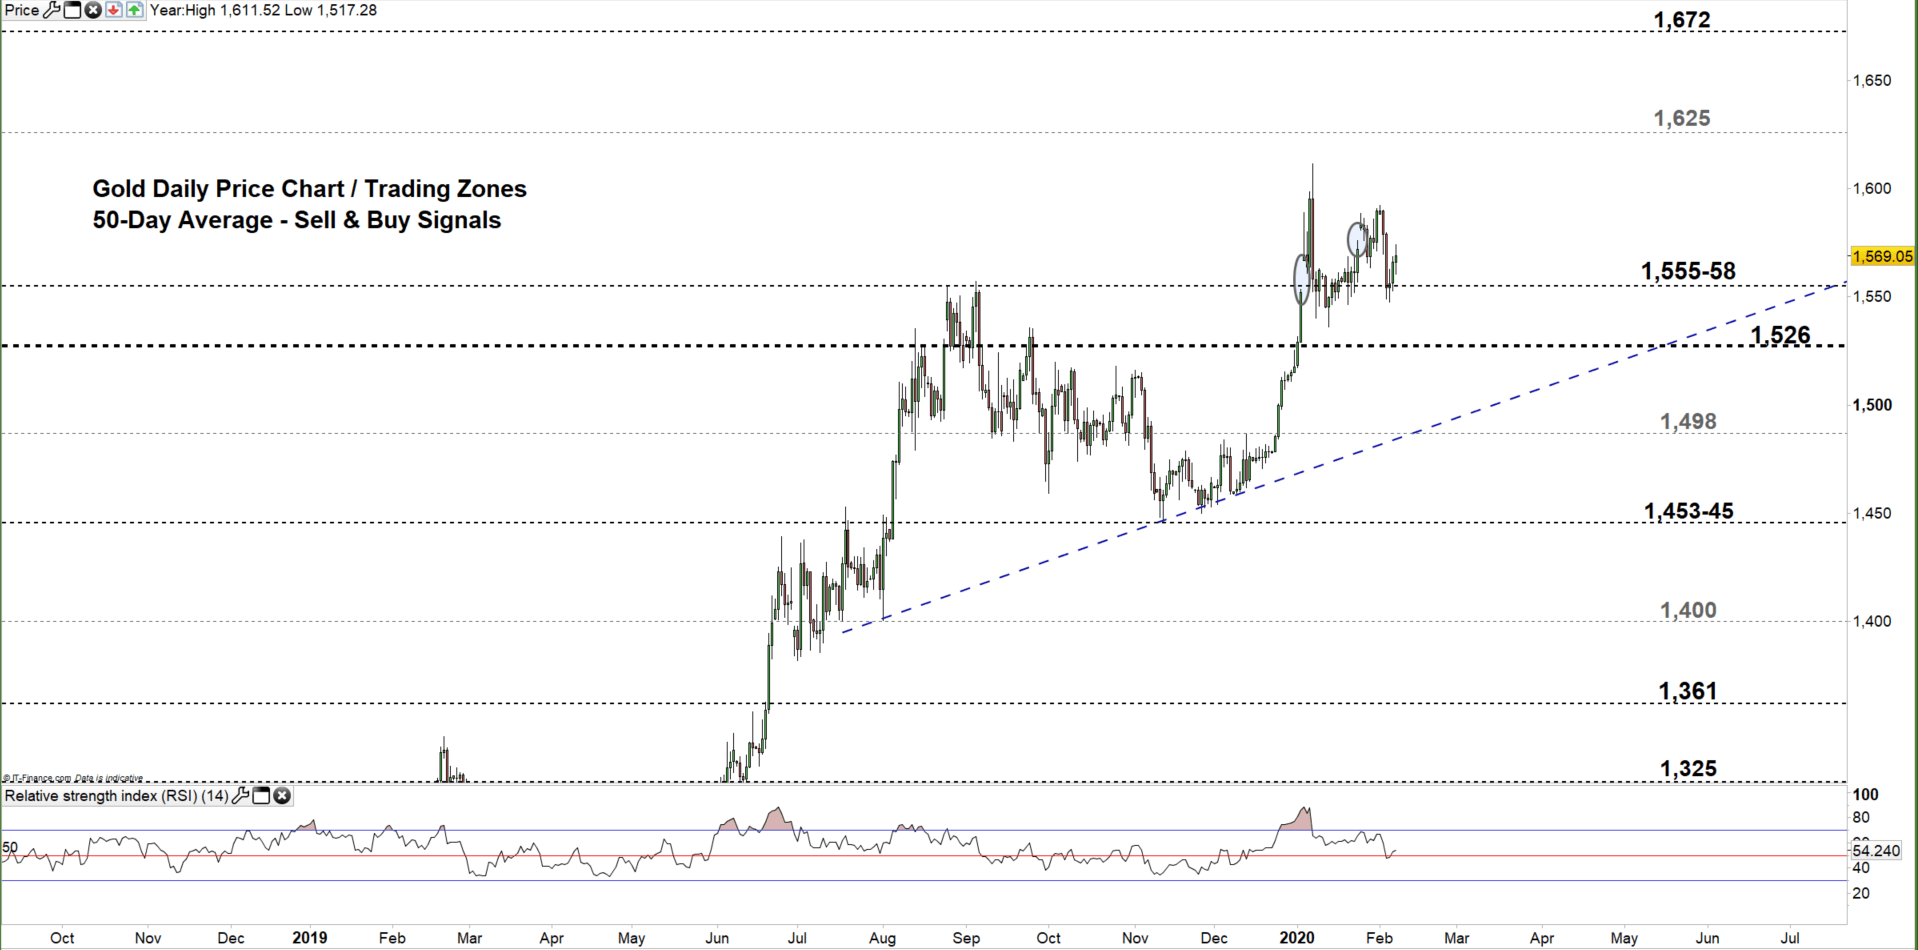
Looking at the daily chart, we notice on Jan 21 Gold corrected its uptrend move and carved out a lower high at $1,568. Last week, the market opened with a runaway gap indicating that bulls were not done yet.
On Wednesday, the price revered to a higher trading zone $1,555- $ 1,625 eyeing a test of the high end of the zone. A close above this level may encourage XAU/USD bulls to push towards $1,672. That said, the weekly resistance levels underlined on the chart (zoomed in) should be monitored.
In turn, a close below the low end reflects bull’s hesitation and may lead some of them to exit the market. This could send XAU/USD towards $1,526. Further close below this level opens the door for bears to take charge and press towards $1,498. In that scenario, special attention should be paid to the weekly support area and levels marked on the chart as some traders might join/exit the market around these points.

Gold Four-HOUR PRICE CHART (DEC 30 – FEB 7,2020)

From the four-hour chart, we noticed that On Feb 5 Gold declined to $1,547- its lowest level in two weeks. The market rallied after and failed in multiple occasions to break above the uptrend line originated from the Jan 14 low at $1,535. Any violation to this line could be considered as a bullish signal.
Thus, a break above $1,592 may cause a rally towards $1,610. Yet, the weekly resistance level underlined on the chart should be kept in focus. On the flip side, a break below the aforementioned Feb 5 low could send XAU/USD towards $1,526. Nevertheless, the Jan 14 low mentioned above should be watched closely.
See the chart to know more about key levels Gold would encounter in a further bearish scenario.
Written By: Mahmoud Alkudsi
Please feel free to contact me on Twitter: @Malkudsi


