Swiss Franc Talking Points:
- Global headwinds have subsided in the past few weeks, allowing the Swiss Franc to make a technical break higher against it’s counterpart safe-haven the Japanese Yen
- As those global risks have subsided, the Franc faces a more technically bearish picture against the New Zealand Dollar
- DailyFX Forecasts are published on a variety of markets such as the US Dollar or the Euro and are available from the DailyFX Trading Guides page.
CHFJPY Technical Outlook
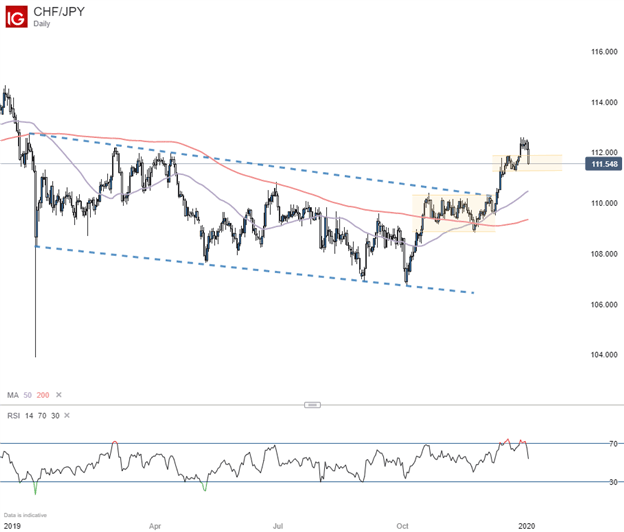
The Swiss Franc faced bearish pressure throughout much of 2019 versus its Japanese counterpart, until a break above the upper-bound of a downward trendline that formed early last year propelled the cross above 112.59 in the final days before the New year, the highest level since December of 2018. The break higher was proceeded by a ‘golden cross’ as the 50-day moving average crossed over it’s 200-day moving average in late November.
While the cross has exhibited strength in recent weeks, signs of exhaustion in the move have manifested to begin 2020, currently trading at 111.57, nearly a full percentage point off the recent high of 112.59 set on Monday. Currently, the cross is settling against its recent range of consolidation from December which may offer support, however a breach lower could push the pair down to a formidable range of consolidation from earlier last year, but support may be provided by the 50-day moving average currently at 110.47 before reaching that level.
CHFJPY Daily Chart

NZDCHF Technical Outlook
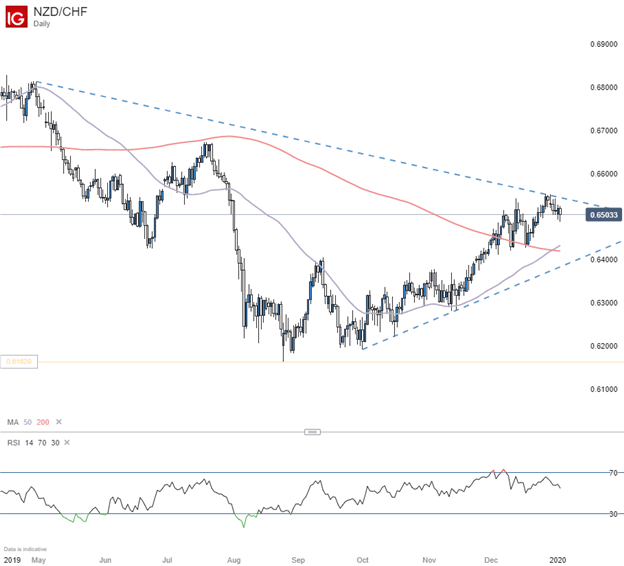
The Franc saw a rough start to 2019 against the New Zealand Dollar as the Kiwi marched 2.59% higher in the first quarter of 2019. However, the strength was short-lived and saw a breakdown which sent the cross to 0.6163 by the following August, its lowest level since 2015. Despite the strength exhibited from the Kiwi in Q1, the Franc closed 2019 1.35% higher against the New Zealand Dollar.
Nonetheless, since hitting its August multi-year low, the cross has now shifted higher, touching 0.6553 on December 26th, the highest level since July. If the reemergence of global risks is held at bay, bullish momentum could extend further as the 50-day moving average has now overtaken the 200-day, forming a golden cross.
NZDCHF Daily Chart

After a small pullback in recent days, bulls will now be looking for recent levels of prior resistance to hold as support before attempting to break above last week’s highs and aim toward the July high of 0.6672, which stands as the next area of resistance.


--Written by Thomas Westwater, Intern Analyst for DailyFX.com
Contact and follow Thomas on Twitter @FxWestwater


