


GOLD FORECAST: XAUUSD TECHNICAL OUTLOOK – NEUTRAL
- The price of gold continues to slump, but potential for a major rebound still looms with XAUUSD eyeing a breakout from its bull flag
- Gold price outlook for the week ahead is neutral, however, with the commodity gravitating around a critical technical level
- Check out this detailed insight outlining How to Trade Gold
For comprehensive fundamental gold price outlook, check out this Gold Forecast: Are Spot Gold Prices (XAU) Set to Resume the Rally?
Gold oscillated throughout the week to leave spot XAUUSD prices roughly unchanged over the last 5 trading days. In the absence of a fundamental catalyst to spark the commodity’s next major move, gold prices could continue to maintain its broader technical pattern – a bull flag.
At the same time, the price of gold has ping-ponged between key levels of confluent support and resistance, which has potential to keep gold price action relatively anchored over the short-term.
GOLD PRICE CHART: WEEKLY TIME FRAME (NOVEMBER 13, 2017 TO NOVEMBER 22, 2019)
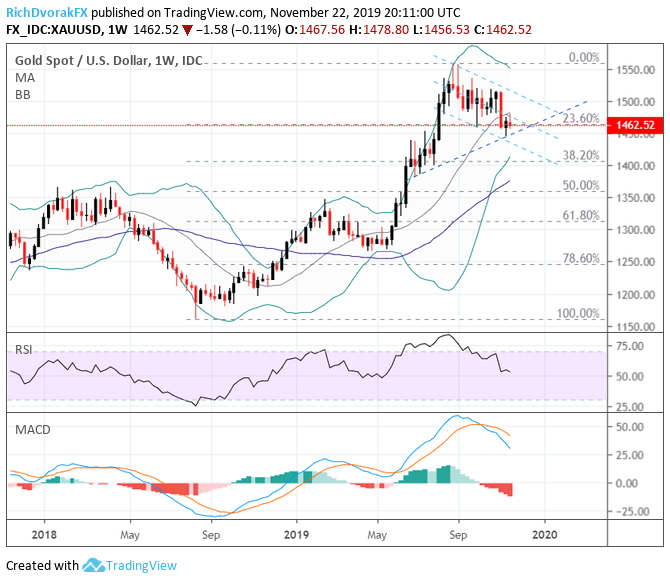
Chart created by @RichDvorakFX with TradingView
We begin our gold forecast with a weekly XAUUSD chart considering a longer time frame helps muffle some of the intraday noise. This brings to focus the downward-sloping channel (a bullish consolidation pattern) etched out by spot gold prices since the commodity topped out at its year-to-date high near $1,560 this past September.
More recently, XAUUSD has rebounded off the lower support band of its bull flag which happened to align closely with the ascending support trendline that connects the series of higher lows printed throughout July and last week’s bottom. Although, the lack of sustained upward momentum has resulted in further bearish divergence as suggested by the MACD amid lingering weakness in spot gold prices.
GOLD PRICE CHART: DAILY TIME FRAME (APRIL 29, 2019 TO NOVEMBER 22, 2019)
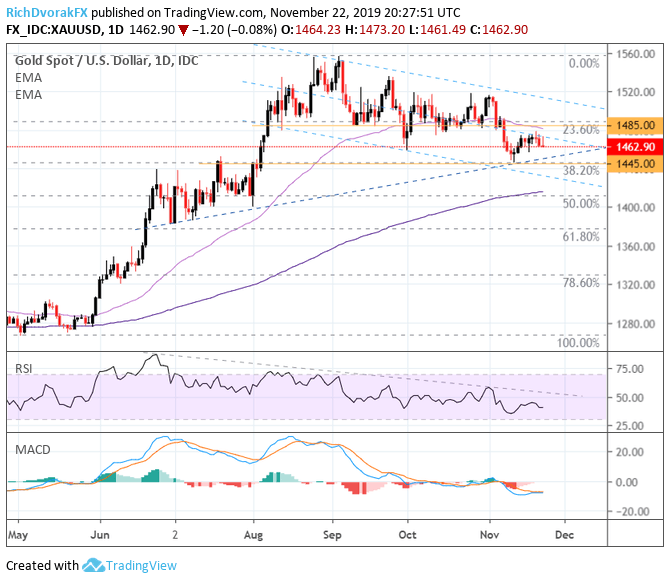
Chart created by @RichDvorakFX with TradingView
Focusing attention on a daily spot gold price chart highlights the commodity’s rough trading range between the levels of confluent support and resistance around $1,445 and $1,485. The technical barriers are underpinned by the 23.6% and 38.2% Fibonacci retracement levels of the bullish stretch in spot XAUUSD prices from May to September.
As such, these technical support and resistance zones will look to keep the price of gold relatively contained – at least until a significant fundamental development comes along that carries enough conviction to recharge gold price action. Although, the 50-day exponential moving average could keep exerting downward pressure on XAUUSD.
The slow and steady drift lower in the RSI since June may be a bit discouraging for gold bugs, but the technical indicator is teetering on the brink of oversold territory while the MACD could be on the cusp of a bullish crossover.
GOLD VOLATILITY & XAUUSD PRICE CHART: DAILY TIME FRAME (JULY 31, 2017 TO NOVEMBER 22, 2019)

Chart created by @RichDvorakFX with TradingView
Yet, the price of gold may continue to face headwinds until there is a material upshift in broader market volatility. Volatility – a metric that quantifies perceived risk or uncertainty for a given asset – can help traders decipher the market’s overarching appetite for risk.
In turn, this can help determine underlying demand for safe-havens such as gold. Expected gold price volatility over the next 30-days is reflected via Cboe’s GVZ Index, which is at its lowest level since this past June and shown overlaid with spot XAUUSD in the chart above.
-- Written by Rich Dvorak, Junior Analyst for DailyFX.com
Connect with @RichDvorakFX on Twitter for real-time market insight


