


CRUDE OIL PRICE FORECAST: WEEKLY TECHNICAL OUTLOOK – NEUTRAL
- Crude oil prices have gyrated higher over the last month though the commodity’s advance may be running out of steam
- The price of crude oil has potential to continue its climb higher but intimidating levels of technical resistance could thwart attempts at further upside
- Check out these Top Crude Oil Trading Strategies & Tips
Crude oil climbed a notable 2.25% this past week as upbeat market sentiment – driven broadly by headlines on US-China trade talks – fostered appetite for risk. However, it was mentioned in the Q4 crude oil technical forecast that the price of crude oil has held a broad range within its overarching wedge pattern seemingly etched out by the commodity since mid-2018.
Such still seems to be the case following the slide lower from September’s swing high and snap-back from the October lows – a continuation in the series of lower tops and higher bottoms. While we pointed out that crude oil price outlook brightened last month following a rebound from the key technical support level around 51.00, the question of ‘how much runway does the recent rally have left’ begins to arise with oil prices now approaching a major zone of technical resistance.
CRUDE OIL PRICE CHART: 4-HOUR TIME FRAME (SEPTEMBER 27, 2019 TO NOVEMBER 08, 2019)
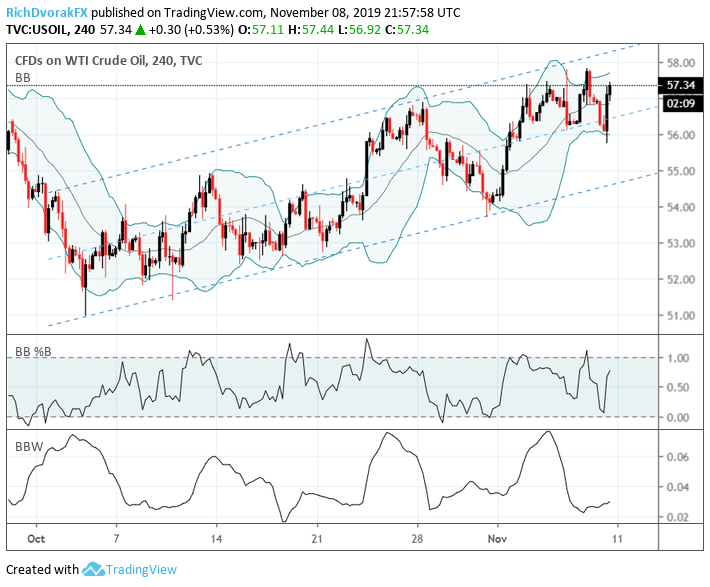
Chart created by @RichDvorakFX with TradingView
Crude oil currently trades comfortably above the 57.00 area after recording a string of higher lows and higher highs over the last month which appears to have formed a bullish channel shown on the chart above. Though there is a risk that it could also be developing a bear flag pattern instead, the commodity nonetheless has potential to continue its climb throughout next week.
Oil prices could test the upper barrier of the rising channel near the 58.00 price level – particularly if a Bollinger Band expansion helps facilitate a move higher. An extension of the bullish trend under development may be in the cards so long as the rising support connecting the October 03 and October 31 lows can keep crude oil prices bolstered.
CRUDE OIL PRICE CHART: WEEKLY TIME FRAME (APRIL 03, 2017 TO NOVEMBER 08, 2019)
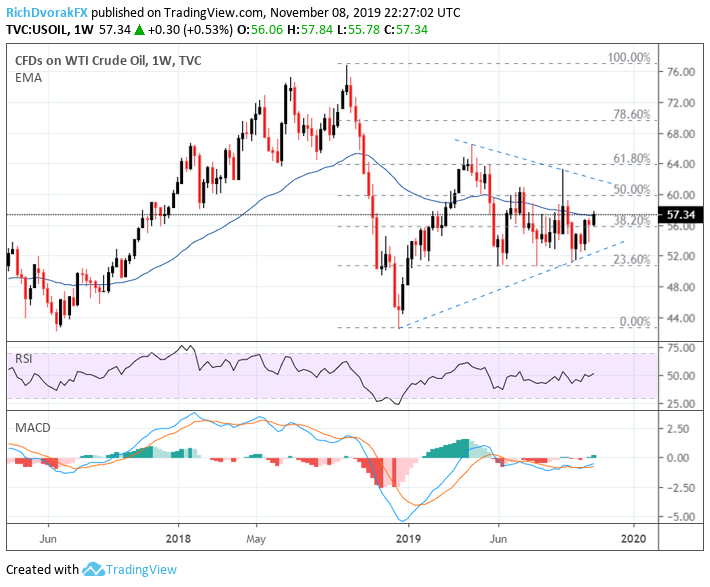
Chart created by @RichDvorakFX with TradingView
On a weekly crude oil price chart we notice bullish momentum is gaining pace judging by positive divergence on the MACD indicator while the RSI has inched its way back above 50. Surmounting technical confluence around the 56.00 handle – underpinned by the 38.2% Fibonacci retracement of crude oil’s nosedive from October to December 2018 – is believed to be a constructive development that favors higher oil prices.
The commodity is still hovering around its 50-week exponential moving average, however, which could hinder further advances. Also noteworthy is the evident string of lower highs printed throughout 2019 and brings to focus the September 19, 2019 intraday top as a nearside obstacle for uptrend continuation.
CRUDE OIL PRICE CHART: DAILY TIME FRAME (APRIL 29, 2019 TO NOVEMBER 08, 2019)
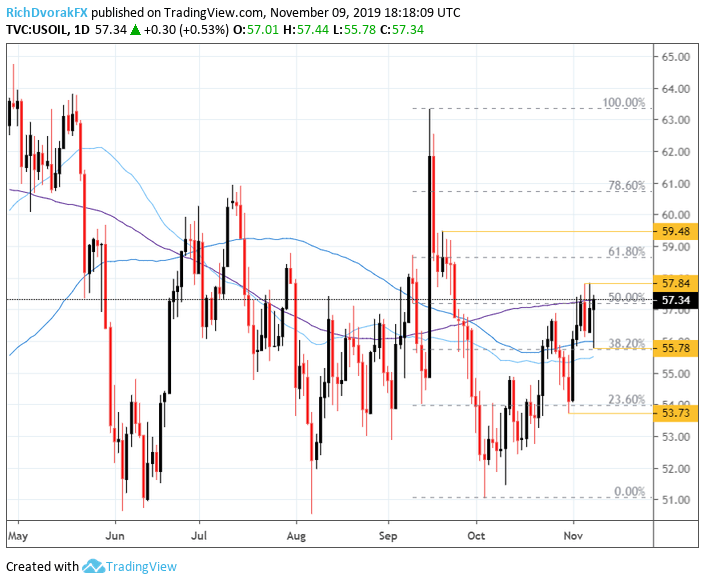
Chart created by @RichDvorakFX with TradingView
The rally in crude oil prices so far this month topped out near the 57.50 area. Though Friday’s candlestick could resemble a bullish hammer – typically indicative that a move higher might lurk on the horizon. The long wick lower stretched to the downside briefly breached the 56.00 handle, but crude oil price action quickly caught bid at this key support level highlighted by its 50-day and 100-day simple moving averages.
The commodity’s zone of technical support around 55.75-56.00 is also underpinned by the 38.2% Fibonacci retracement of its trading range since the Saudi Aramco pipeline attack. Correspondingly, a jump higher in the price of crude oil early next week could provide confirmation that the ongoing uptrend has strong potential to continue.
Yet the 200-day SMA remains an intimidating obstacle for crude oil bulls to overcome and last week’s high of 57.84 could also pose as a point of technical resistance. Beyond these nearside technical barriers, however, the 61.8% Fib and mid-September consolidation around the 59.00-59.50 area could serve as possible upside objectives.
OIL VOLATILITY INDEX PRICE CHART: DAILY TIME FRAME (AUGUST 16, 2018 TO NOVEMBER 08, 2019)
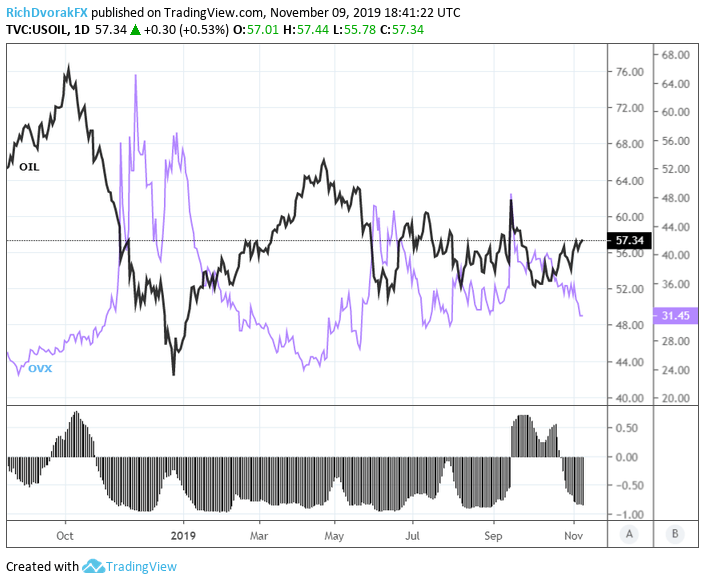
Chart created by @RichDvorakFX with TradingView
While it may be feasible for measures of volatility like OVX to keep bleeding lower – particularly if the US and China continue to inch closer toward inking a phase one trade agreement – there could be a brewing risk of complacency. That said, an abrupt spike in volatility would likely bode ill for risk assets such as crude oil given their generally strong inverse correlation.
-- Written by Rich Dvorak, Junior Analyst for DailyFX.com
Connect with @RichDvorakFX on Twitter for real-time market insight


