


Gold Technical Forecast
- Gold prices experienced their worst week in 3 years, where too next?
- Rising support channel and horizontal range may keep uptrend intact
- Increasing net-long bets favor the downside scenario ahead however
Get our free guide to help build confidence in your gold trading strategy !
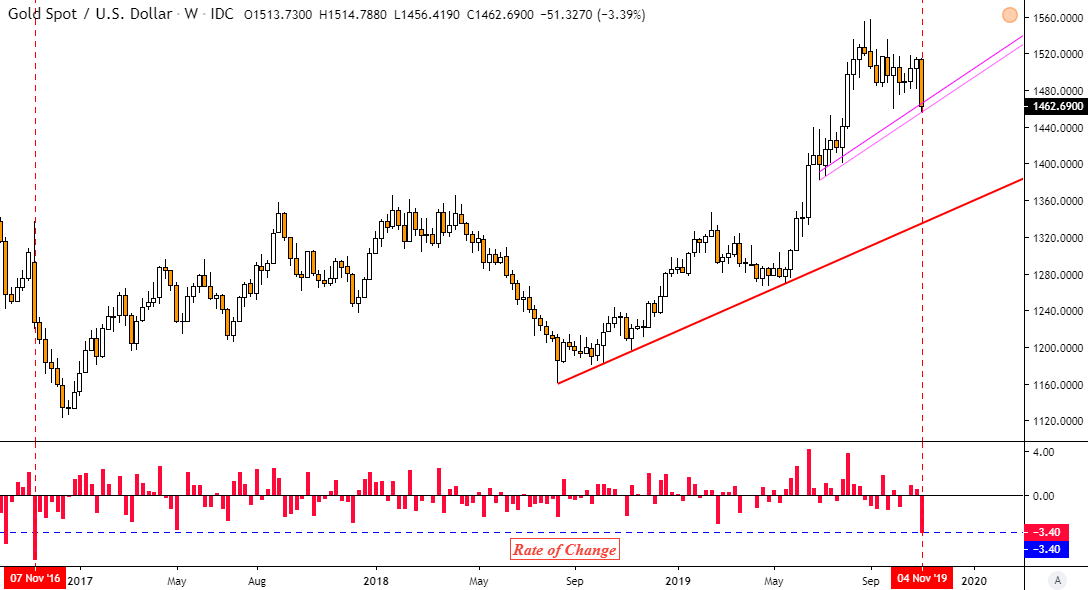
Over the past 5 trading days, a synchronized climb in the US Dollar and local front-end government bond yields weighed against anti-fiat gold prices. On a weekly basis, this resulted in about a 3.4 percent decline in the precious metal. This marked the worst performance since the week of November 7, 2016 which was coincidentally precisely three years ago as prices closed at their lowest since the beginning of August.
Gold Weekly Chart
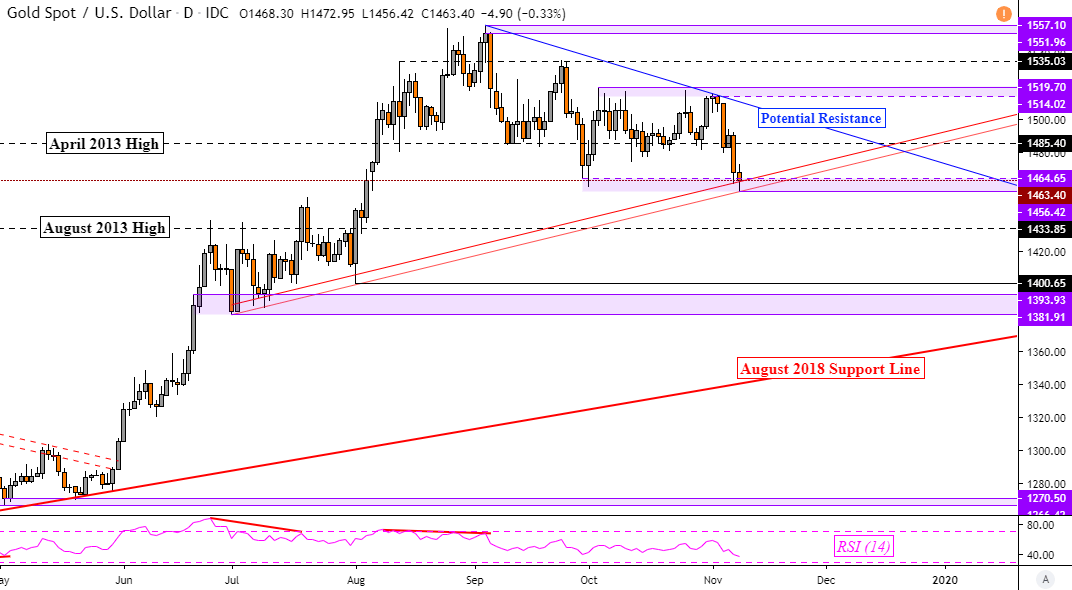
So where does this leave the yellow metal from here? Using a daily chart, taking a closer look reveals that XAU/USD sits at a key psychological juncture. This is a combination of a rising support channel from July, September lows, and the November 8 lower wick. The latter two leaves a horizontal range of support between 1456.42 and 1464.65.
A daily close under this juncture would open the door to a reversal of the uptrend that has prevailed since May. It also exposes the period of consolidation bullion experienced during this past summer which closely aligned with the August 2013 high at 1433.85. But, the next key support level to take out would be the late June and July lows which is a range between 1381.91 to 1393.93.
On the flip side, the rising support channel could keep the uptrend intact. That could pave the way for a bounce back towards near-term resistance around 1485.40. A daily close above this price would expose what could be a potential falling trend line from August – blue line on the chart below. In the near-term, there are warning signs that the more-likely scenario ahead could be a continuation of the downtrend since August.
Gold Daily Chart
Gold Charts Created Using TradingView
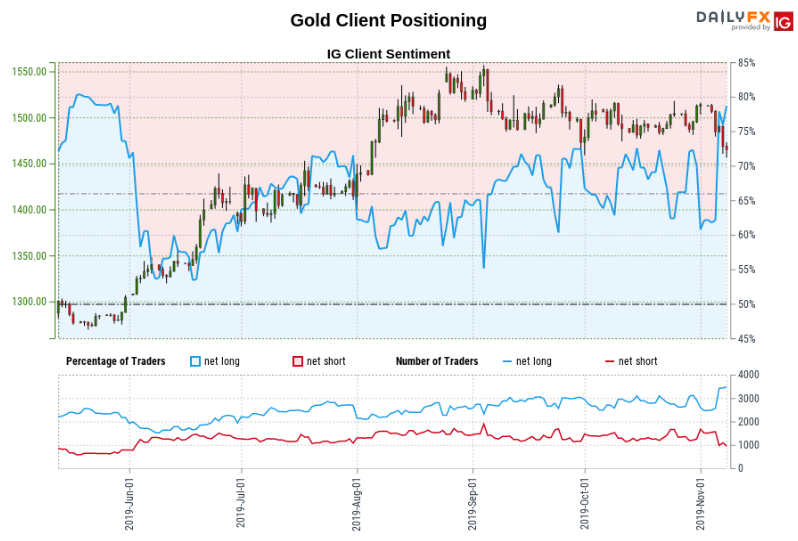
IG Client Sentiment
Taking a look at the latest IG Client Sentiment Report from November 8 shows gold net-short bets outpacing those net long. This leaves about 77.66 percent of traders biased to the upside on the yellow metal. Traders are further net long than yesterday and compared to last week.The combination of current sentiment and recent changes gives us a stronger Gold-bearish contrarian trading bias.
To learn more about how to use sentiment in your own trading strategy , join me this week on Thursday at 01:00 GMT as I uncover what IG Client Sentiment has to say about the prevailing trends in financial markets and follow me on Twitter here @ddubrovskyFX for timely updates!
Gold Client Positioning
FX Trading Resources
- Having trouble with your strategy? Here’s the #1 mistake that traders make
- See how the Gold is viewed by the trading community at the DailyFX Sentiment Page
- Just getting started? See our beginners’ guide for FX traders
--- Written by Daniel Dubrovsky,Analyst for DailyFX.com
To contact Daniel, use the comments section below or @ddubrovskyFX on Twitter


