


Crude Oil Price Forecast Talking Points:
- Friday’s US crude oil rally was the biggest daily move in a month-and-a-half
- A bullish channel has formed in the past month that fights neatly into a larger descending triangle
- Watch crude oil’s own volatility versus its correlation to risk trends and growth forecasts
What do the DailyFX analysts expect for the Euro through the fourth quarter of 2019? What about the other majors, indices and commodities? Download our free Q4 Forecasts - Fundamental and Technical on the DailyFX Free Trading Guides Page.
Technical Forecast for Crude Oil: Neutral
Crude oil continues to trade in a well-established range. In fact, its picture could be described as a nesting of congestion patterns which have grown increasingly restrictive over time. Yet, while our recent trading territory has been substantially smaller than what it was a year ago (approximately $35 thanks to the fourth quarter plunge), there is still plenty of room between a more influential pattern for 2019 specifically – between 62 and 51. Many traders shy away from technical patterns that don’t seem to harbor extreme breakout potential with seemingly unlimited range for follow through. Yet, even when these rare setups seem to present themselves, the pattern rarely tends to fully play out. If we evaluate the crude for the opportunities it has while keeping tabs of the grander scenarios should they eventually come to pass, we will be better off to navigate this (and really any other) market.
To fully appreciate the overview of the technical bounds we are dealing with, 13-months of daily price action will give you the full picture. At the very extremes, there are multi-year trendlines that create a wedge presently now falling out at 69 and 47. It would take an extreme charge to reach these bounds in a week’s time, and we will see more critical levels fall before we have to seriously contemplate their influence. In the trendline resistance that has defined 2019, the 62 handle is close to the September swing high and the mid-point of the past year’s wider range. More immediate to the upside, I’m watching the 200-day moving average and a longer-term (but less important) Fibonacci level that falls conveniently inline with October’s swing high at 57.
Lower, the boundaries are more closely grouped. Up from that aforementioned multi-year trendline, we have an almost horizontal range support at 51. A rising trend channel that has developed just this past month stands presently at 54. That is the level and technical boundary that I believe will draw the most pressure in the week ahead.
Chart of US Crude Oil Prices with 200-Day Moving Average (Daily)

Chart created with the TradingView Charting Platform
Looking to the shorter time frame chart, the more proximate barriers come into view. There is a gradual bullish momentum playing out with faster advance but more drawn out retreat. The 54 level should not be considered a laser level of support – meaning a slip below will ensure a break with follow through. There are considerable tails when this chart pattern is tested. To the topside, 57 holds more than just that 200-day moving average, it seems a frequented zone of restraint over the previous months.
Chart of US Crude Oil Prices (4-Hour)

Chart created with the TradingView Charting Platform
When I have the data available (as is the case with futures), I try to always incorporate trading activity data to further inform the convergence of price and time. Below the oil chart is volume with a 20-day moving average – equivalent of one trading month – and the course is unmistakable. The average trading activity has dropped to the lowest level since September, which happens to correspond to other capital markets’ turnover. Overlaid on the price chart, we have the CBOE’s crude oil volatility index. This is implied, so the assumptions are set very low. This too is in line with most other markets; and as with those other markets, I am extremely dubious that conditions are that stable.
Chart of US Crude Oil Prices with Oil Volatility, Volume and 20-Day Average (Daily)
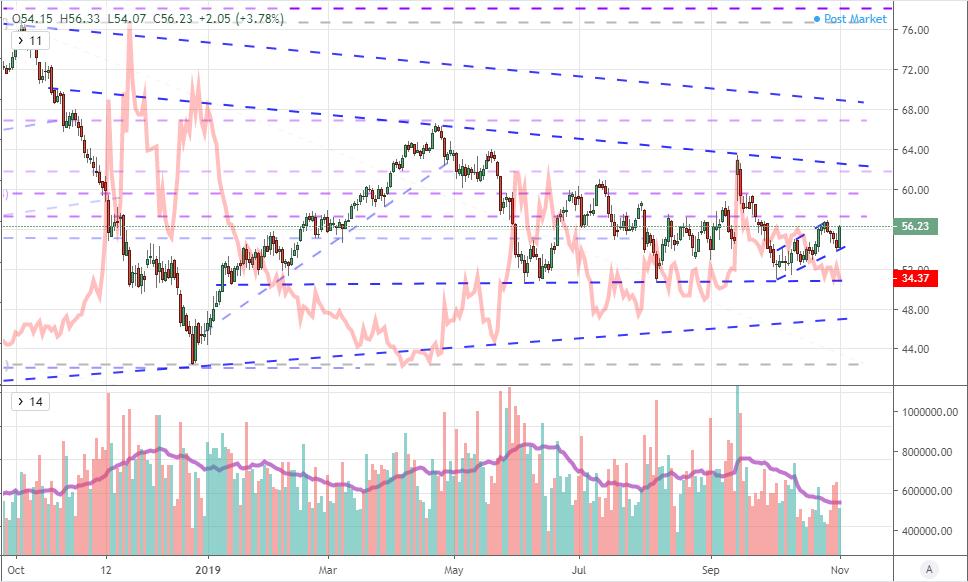
Chart created with the TradingView Charting Platform
When we are looking for motivation for a market that seems to be prone to volatility but light on trend, it is good to find ‘fundamental’ connections that can be charted. Crude is a speculative-oriented asset over time as appetite for the commodity tends to rise when growth is seen swelling capital markets as well. That correlation has certainly distorted when comparing to US equities, but it isn’t too far off of more restrained sentiment measures such as the ‘rest of world’ VEU equity ETF. Still, this is a struggle when it should be more productive. That could show a skew towards bearish developments in risk trends.
Chart of US Crude Oil Prices with S&P 500 and 60-Day Correlation (Daily)
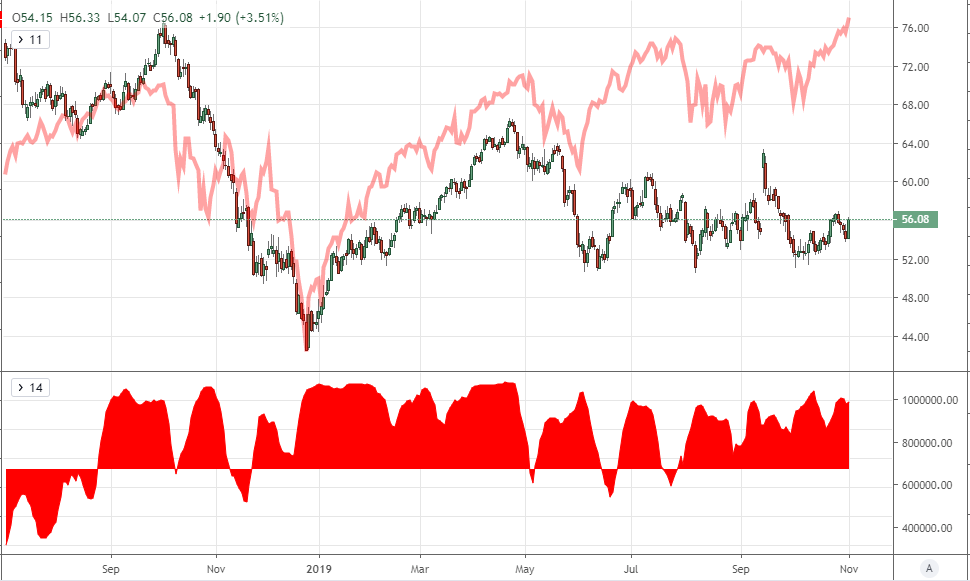
Chart created with the TradingView Charting Platform
Looking at the more rudimentary connection of oil to growth projections, it can be difficult to establish the market’s measure for economic activity. Fortunately for us, the US 10-year to 2-year Treasury Yield curve has become a favorite among armchair economists in the market again. Here, the correlation is not nearly as robust, but this may be a factor holding back a tighter link to the S&P 500.
Chart of US Crude Oil Prices with US 10yr/2yr Yield Curve and 20-Day Correlation (Daily)

Chart created with the TradingView Charting Platform
See how retail traders are positioned in Crude Oil along with other key FX pairs, indices and oil on the DailyFX Sentiment page.
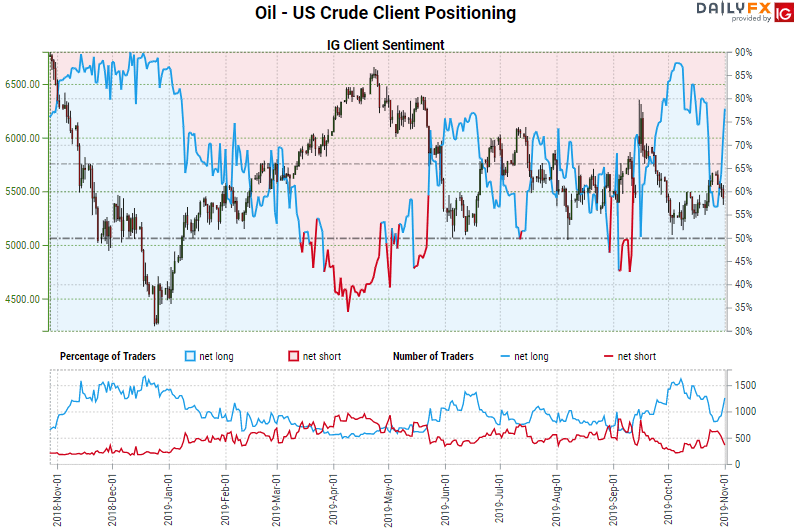
If you are looking for speculative positioning to deliver you insight, the medium- to long-term orientation of crude oil traders are will not give you much to work with. The net speculative futures positioning offered in the weekly COT report from the CFTC signals the same lack of conviction that underlying price has cued this year. This is a situation in which the shorter-term interests of retail CFD traders better represents the conditions and approach. The range appetite shot higher when oil bounced to 54. Keep tabs on this early next week as we return to 57.
Chart of Net Speculative Positioning in US Oil Futures from CFTC Report (Weekly)
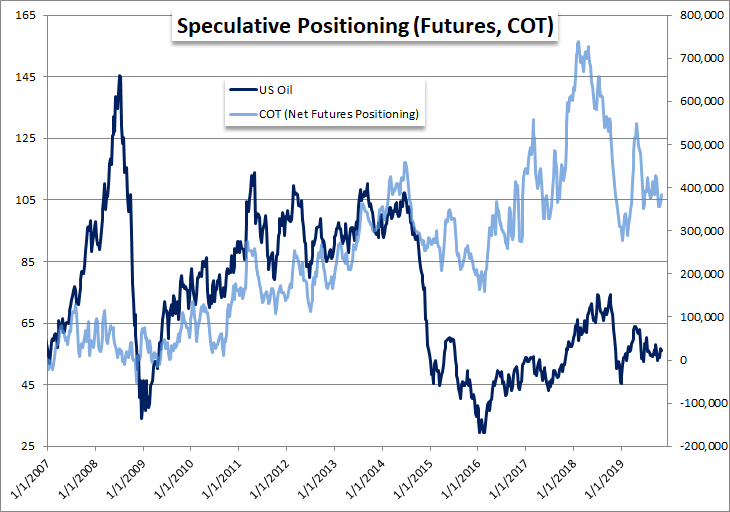
Chart of Retail Trader Positioning from IG Clients (Daily)
.


