


AUD/USD TECHNICAL FORECAST: NEUTRAL
- Australian Dollar break of September top puts trend resistance under fire
- Long-term chart positioning continues to argue for a broadly bearish bias
- Downside tilt likely needs counter-trend line break to become actionable
Get help building confidence in your AUD/USD trading strategy with our free guide!
The Australian Dollar enjoyed impressive upside momentum last week, rising to the highest level in three months against its US counterpart. Prices even managed to breach resistance at the mid-September swing top, moving to challenge the outer bound of the downward trend guiding them lower since December 2018.
Daily-close confirmation of a break above this barrier would mark a significant change of tone for AUD/USD, neutralizing near- to medium-term selling pressure and setting the stage for a more pronounced recovery. Such a move would see the next layer of significant resistance at 0.7082, the mid-July high.
AUD/USD Daily Price Chart

Chart created with TradingView
Nevertheless, resistance continues to hold for now, keeping the broad-based bias bearish until further notice. Meanwhile, zooming out to the monthly chart for a look at longer-term positioning makes a compelling case for a corrective interpretation of recent gains.
AUD/USD Monthly Price Chart
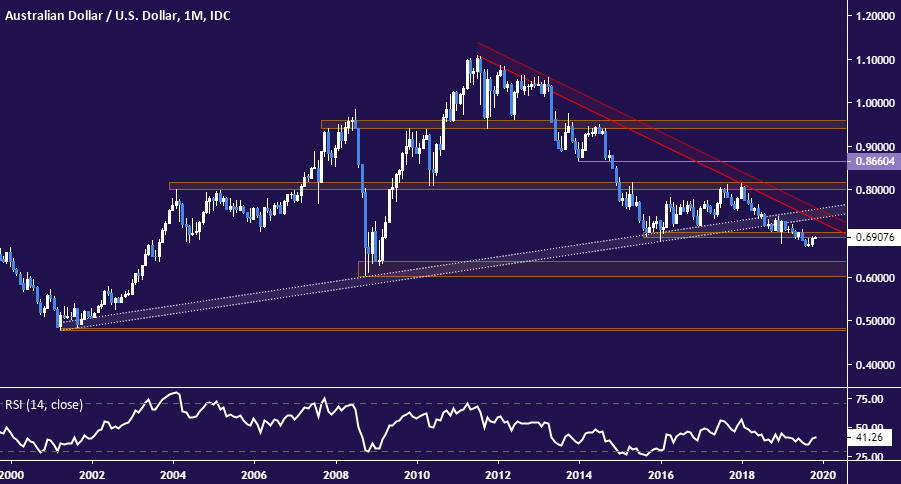
Chart created with TradingView
August saw AUD/USD break below a four-year support shelf in the 0.6900-0.7018. September was then marked by digestion and October by a corrective rise. The month ended with prices falling conspicuously short of reclaiming even a preliminary foothold above this barrier.
With that in mind, it seems entirely plausible to envision October’s price action as a retracement within the broader confines of a larger bearish trend change. If the start of that move was last year’s break of rising 17-year support, the push in August can be seen as acceleration. November may thus mark resumption.
Within this framework, the path of least resistance points to an eventual descent below the 0.65 figure to test the 0.60-0.6352 zone. Neutralizing that scenario in earnest seems to call for a decisive break above falling trend resistance dating back to August 2011, now at 0.7597.
Having said that, a look back at the daily chart reminds of the absence of an actionable short trade signal at the moment. If immediate resistance holds and signs of topping emerge, a subsequent break of counter-trend support set from October lows seems like a tactical prerequisite to lean into a downside push.
--- Written by Ilya Spivak, Sr. Currency Strategist for DailyFX.com
To contact Ilya, use the comments section below or @IlyaSpivak on Twitter
AUSTRALIAN DOLLAR TRADING RESOURCES
- Just getting started? See our beginners’ guide for FX traders
- Having trouble with your strategy? Here’s the #1 mistake that traders make
- Join a free live webinar and have your trading questions answered
OTHER TECHNICAL FORECASTS:


