


GOLD TECHNICAL FORECAST: NEUTRAL
- Gold prices may be on the cusp of the next phase in rising trend
- If confirmed, Flag pattern implies a rally to test above $1600/oz
- Longer-term positioning warns a bearish scenario may prevail
Check out our Q4 gold forecast to see what will drive the price trend through year-end!
Gold prices have drifted lower in a narrow band established since forming a top in early September, passing through support guiding the upward trend since mid-year. It remains to be seen whether current positioning represents the start of a bearish reversal or a corrective pullback before another topside push.
The latter scenario would echo the digestive pause between late February and May. That marked a break of the rally from mid-August 2018 that retraced a bit of the advance and carved out a new base and slope for subsequent bullish resumption.
If the latest pullback is confirmed as bullish Flag continuation pattern on a daily close above its upper boundary, a similar outcome would be hinted. The pattern’s implied measured-move objective would call for prices to breach the latest swing top and test above the $1600/oz figure.

Daily gold chart created with TradingView
The downside argument is yet to be conclusively invalidated however. A spirited foray higher was met with a wave of selling, producing a dramatic-looking wick on the October 25 daily candle. That speaks to a lack of bullish conviction that might open the door for sellers to take the reins in earnest.
Zooming out to the monthly chart reveals another worrying sign for buyers. To play out the Flag formation, prices would need to breach long-standing support-turned-resistance in the 1522.93-60.00 area. The appearance of negative RSI divergence warns of ebbing momentum as this barrier is tested.
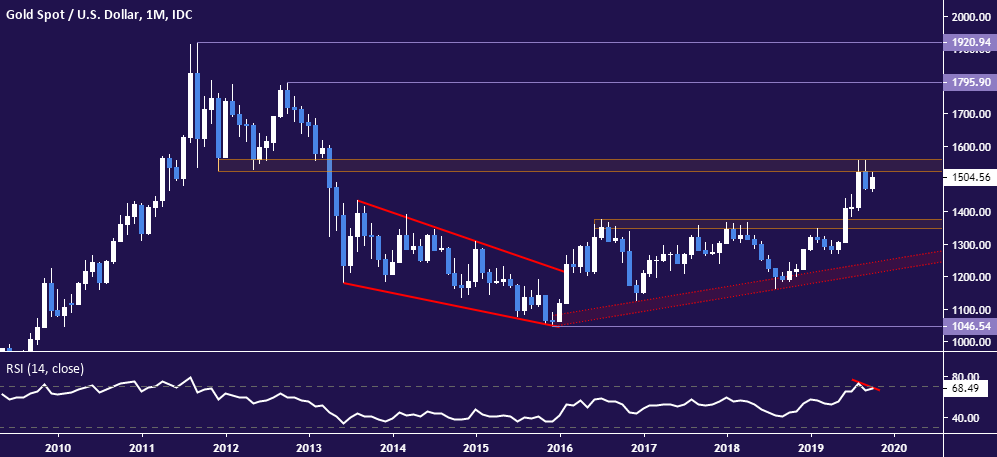
Monthly gold chart created with TradingView
The week ahead might well offer resolution one way or the other. The economic calendar is packed with heavy duty event risk – the Fed rate decision, most of all – with credible scope for breakout volatility. However, longer-term fundamental forces might well be conspiring to engineer a selloff.
--- Written by Ilya Spivak, Sr. Currency Strategist for DailyFX.com
To contact Ilya, use the comments section below or @IlyaSpivak on Twitter
GOLD TRADING RESOURCES
- Just getting started? See our beginners’ guide for FX traders
- Having trouble with your strategy? Here’s the #1 mistake that traders make
- Join a free live webinar and have your trading questions answered
OTHER TECHNICAL FORECASTS:


