


- Crude Oil prices consolidate into October range- focus remains on key support at 51
- Check out our 2019 projections in our Free DailyFX Oil Trading Forecasts
- Join Michael for Live Weekly Strategy Webinars on Mondays at 12:30GMT
Crude Oil prices are down more than 1.5% this week with WTI trading just above a critical support zone we’ve been tracking for more-than three months now. These are the updated targets and invalidation levels that matter on the oil price weekly chart. Review my latestWeekly Strategy Webinar for an in-depth breakdown of this Loonie price setup and more.
New to Forex Trading? Get started with this Free Beginners Guide
Crude Oil Price Chart – Crude Weekly
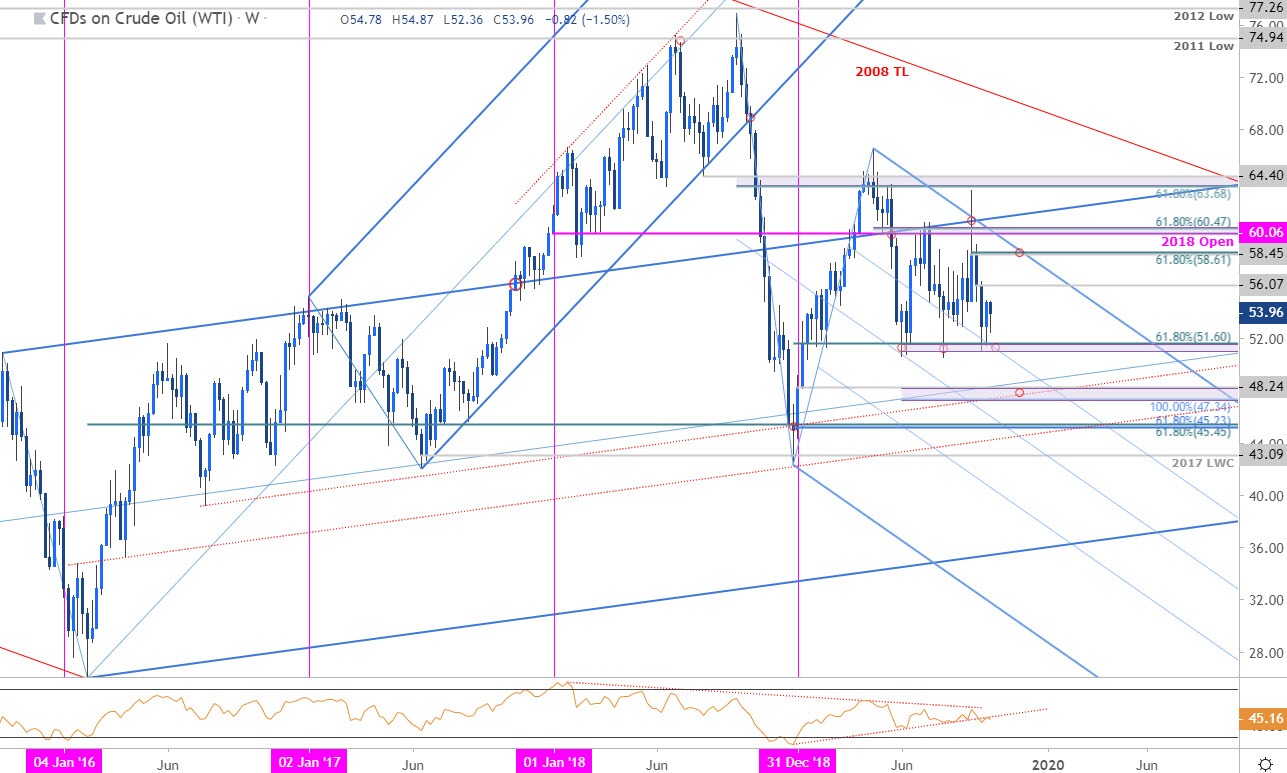
Chart Prepared by Michael Boutros, Technical Strategist; Crude Oil (WTI) on Tradingview
Notes:In my previous Oil Price Outlook we noted that WTI was, “approaching a multi-month support zone and leaves the immediate short-bias at risk while above the 51-handle.” Price registered a low into key support at 51.00/60 before rebounding with oil continuing to consolidate within the October opening-range. Note that weekly RSI has broken below a multi-month support trigger with no break in price to validate the momentum shift – risk for some sideways action here for now.
Initial resistance is eyed at 56.07 (reversal-week close) with broader bearish invalidation at the September high-week close / 61.8% retracement at 58.45/61. A break lower from here exposes critical support at 47.34-48.24 where the 100% extension of the decline off the yearly highs and the yearly low-week close converges on longer-term trendline- look for a stronger reaction there IF reached.
For a complete breakdown of Michael’s trading strategy, review his Foundations of Technical Analysis series on Building a Trading Strategy
Bottom line:Oil prices have been testing this key support barrier since June and while the broader risk remains lower, the short-bias remains vulnerable while above the 51-handle. From a trading standpoint, looking for topside exhaustion on recoveries ahead of 56.07IF price is indeed heading lower with a downside break targeting subsequent support objectives closer to longer-term uptrend support.
Crude Oil Trader Sentiment – WTI Price Chart

- A summary of IG Client Sentiment shows traders are net-long crude oil - the ratio stands at +2.95 (74.71% of traders are long) – bearish reading
- Long positions are 8.23% lower than yesterday and 5.11% lower from last week
- Short positions are32.46% higher than yesterday and 9.42% higher from last week
- We typically take a contrarian view to crowd sentiment, and the fact traders are net-long suggests Oil - US Crude prices may continue to fall. Yet traders are less net-long than yesterday and compared with last week and the recent changes in sentiment warn that the current Oil - US Crude price trend may soon reverse higher despite the fact traders remain net-long.
See how shifts in Crude Oil retail positioning are impacting trend- Learn more about sentiment!
---
Previous Weekly Technical Charts
- Gold (XAU/USD)
- Euro (EUR/USD)
- US Dollar (DXY)
- New Zealand Dollar (NZD/USD)
- Canadian Dollar (USD/CAD)
- Sterling (GBP/USD)
- Silver (XAG/USD)
Learn how to Trade with Confidence in our Free Trading Guide
--- Written by Michael Boutros, Technical Currency Strategist with DailyFX
Follow Michael on Twitter @MBForex


