


Australian Dollar Forecast Talking Points:
- The two-day AUDUSD climb through Friday was the biggest since Jan 31st
- AUDUSD has cleared immediate congestion resistance and faces a lattice of levels above
- Broadly, the Australian Dollar is just off of a 10-year low which has bulls salivating for reversal
What do the DailyFX analysts expect for the Euro through the fourth quarter of 2019? What about the other majors, indices and commodities? Download our free Q4 Forecasts - Fundamental and Technical on the DailyFX Free Trading Guides Page.
Technical Forecast for Australian Dollar: Bearish
If unimpeded, the Australian Dollar could find itself in a remarkably technical picture whereby a systemic reversal seems a very real possibility. Yet, we shouldn’t let the currency’s position in the high-level range and some early progress hypnotize us to extreme swings – moves that are remarkably atypical across the FX and capital markets. There is certainly potential for the Aussie Dollar to regain traction if certain external elements open the way to follow through. With key technical levels ahead and most Aussie crosses not yet reflecting even the tentative charge of AUDUSD, setting conviction according to technical milestones would be wise.
Starting our technical review of the Australian Dollar, we naturally start with AUDUSD. And, that is where the accelerator on enthusiasm is instantly depressed. This past week, the ‘major’ earned its first meaningful technical break higher since the early September surge. Previously lingering in the congestion established the past month between 0.6800 and 0.6700, the pair launched higher through the final 48 hours of the trading week to clear the trendline resistance back to July’s peak, the moderate 0.6800 range high and 38.2% Fib of the past three-month’s range at 0.6825. That two-day rally was the biggest since the blow off on January 31st, and it was befitting the meandering around the 10-year lows of 0.6700.
The congestion at such extraordinary lows builds appetite for an eventual reversal. If we do continue to experience lift, we will have to clear some remarkably tangible levels of resistance – breaks that would likely reinforce momentum were it to happen. To start the trading week, the proximity of the 100-day moving average at 0.6860 makes it immediate concern. Above that, we have the September swing high which is very close to the descending trendline resistance which stretches back to June 2018 around 0.6900. Not much further above that, we have the 200-day moving average at 0.6970 which this pair has not been traded above since March 2018.
Chart of AUDUSD with 100-Day and 200-Day Moving Averages (Daily)
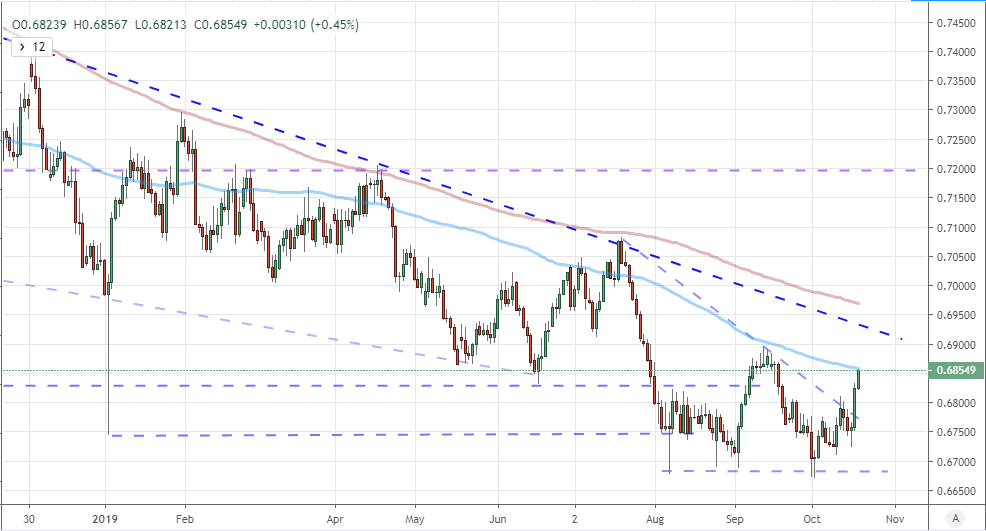
Chart created with the TradingView Charting Platform
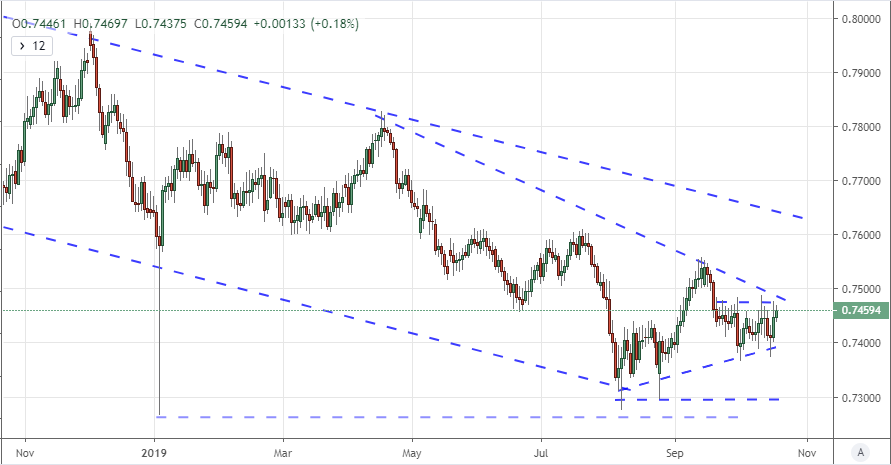
One of the caveats to the charge we are seeing behind AUDUSD is that this looks to be predominantly a US Dollar slide rather than an Australian Dollar climb. That is an important qualifier if you are looking for momentum or trading in the AUD crosses. If the Dollar slide versus the Euro stalls for example, the same is likely to happen in AUDUSD. Taking a look at an equally-weighted Aussie Dollar index (below), we have similar congestion but as yet no break higher. A break is inevitable, but that could take further weeks and it could also prove a bearish resolution.
Chart of Equally-Weighted Australian Dollar Index (Daily)
Following the motivations angle, another related chart that traders would do well to watch when projecting either AUDUSD or other Aussie crosses is the USDCNH. The bearing of the Chinese Yuan has significant sway over the Australian currency given their economic connection. The correlation is also simply robust (below the USDCNH is inverted). If USDCNH moves below 7.05, it could translate into a stiffer run to 0.69 but a break beyond that would probably come with a drop back below 7.00.
Chart of AUDUSD Overlaid with CNHUSD Exchange Rate (Daily)
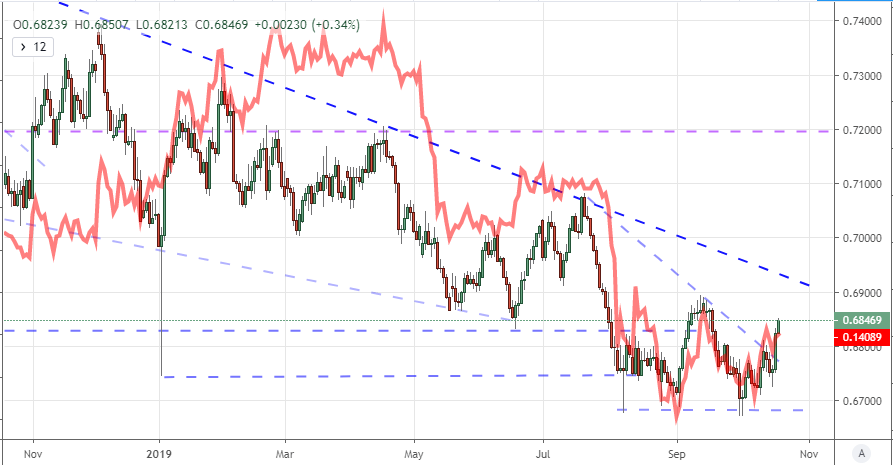
Chart created with the TradingView Charting Platform
Another wind buffeting the Australian Dollar lately is its yield, or carry. Below, we have the same AUDUSD overlaid with the 10-year Australian government bond yield. These is a strong correlation and even stronger when we show it with a spread to the US counterpart. Expecting a rebound in yields in the country and more broadly would suggest an improved outlook for economy and general investor enthusiasm, which is more than a stretch at the moment.
Chart of AUDUSD with 10-Year Australian Government Bond Yield (Daily)
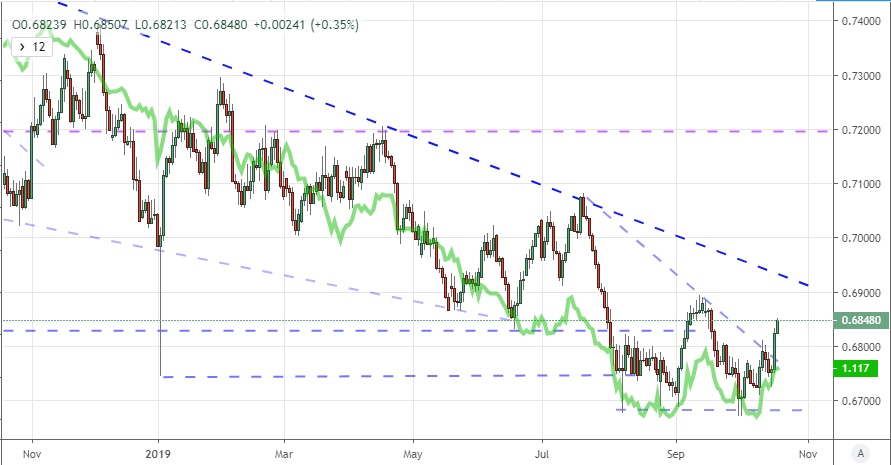
Chart created with the TradingView Charting Platform
Among the crosses to keep close tabs on, the AUDUSD is obviously the principal player whose own weight can inspire other crosses to follow in tow. Yet, among the other crosses with meaningful technical benchmarks in their immediate vicinity that can serve as catalyst and points to work entry and exit around, AUDCAD is interesting. There is a range high from the past month around 0.9025 which is close to the 100-day moving average and trendline resistance stretching back to May’s highs. Breaking that can draw greater attention and thereby more bid.
Chart of AUDCAD with 100-Day Moving Average (Daily)
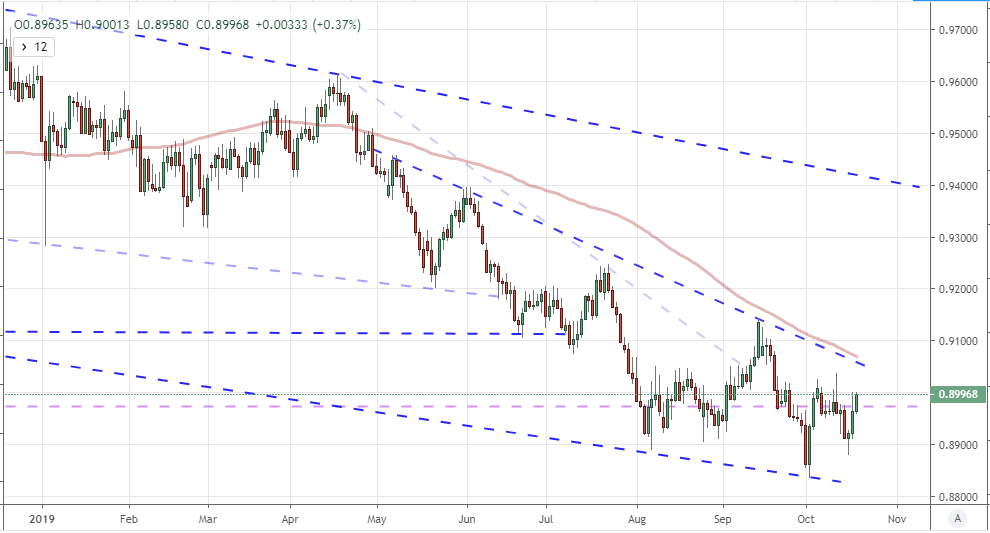
Chart created with the TradingView Charting Platform
Another cross that I find particularly interesting for technicals – but which owes all of its fundamental allegiance to the counter currency – is GBPAUD. The daily chart is interesting in itself, but the weekly picture is far more striking. The top of a rising trend channel stretching back to 2016 is close to the recent highs the pair has set and that in turn aligns to the midpoint of the past six years’ range. Direction depends heavily on Brexit proceedings but break or reversal, this has potential.
Chart of GBPAUD (Weekly)

Chart created with the TradingView Charting Platform
See how retail traders are positioned in Gold along with other key FX pairs, indices and oil on the DailyFX Sentiment page.
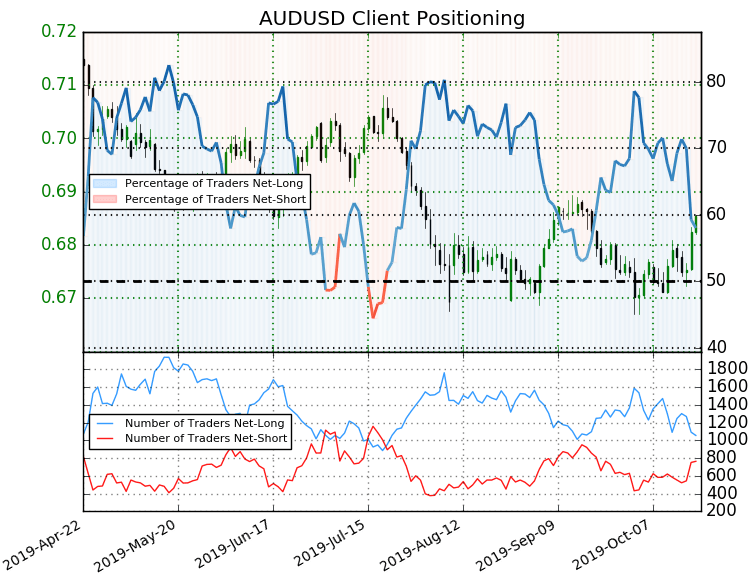
For speculative positioning in the Australian Dollar, there is significantly more complacency than what the convergence of short-term and long-term technicals would seem to inspire. Through the longer horizon traders measured through speculative futures positioning from the COT, there has long been a steady net short position that hasn’t changed too much – certainly not build as the AUDUSD continued to fall. Among the short-term lines, there is limited conviction that a breakout situation is taking place. Bullish positions have dropped despite last week’s technical clearance and short interest has picked up as it often does for a range play. It seems the markets have grown very comfortable with the lack of commitment these past months.
Chart of Net Speculative Positioning in Aggregate AUDUSD Futures from CFTC Report (Weekly)

Chart of Retail Trader Positioning from IG Clients (Daily)
.


