


CRUDE OIL FORECAST 4Q 2019 – SUMMARY POINTS:
- Crude oil price action eyes a breakout from multi-year support and resistance trendlines as oil volatility rises into Q4-2019
- Download our comprehensive Q4-2019 Crude Oil Price Forecast for free which dives deeper into the fundamental and technical outlook for crude oil prices
- Check out these Top Crude Oil Trading Strategies & Tips
The price of crude oil consolidated further within its overarching wedge pattern during the third quarter. Directing attention to a weekly crude oil price chart as we transition into Q4-2019 underscores the dominating wedge formation being etched out by the commodity; the pattern becomes even more evident when focusing on price action since mid-2018 judging by the recent series of lower highs and higher lows.
CRUDE OIL PRICE CHART: WEEKLY TIME FRAME (DECEMBER 2016 TO SEPTEMBER 2019)
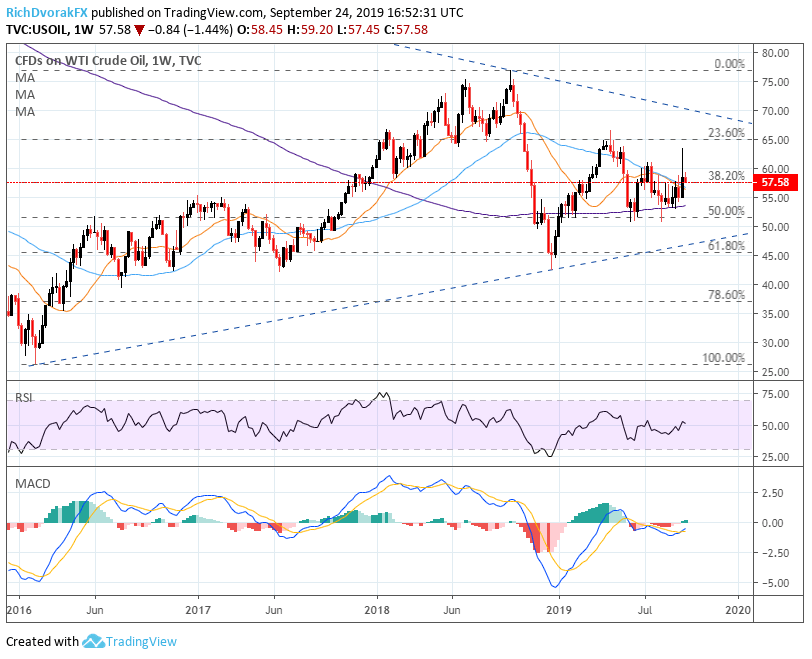
Chart created by @RichDvorakFX with TradingView
Crude oil prices could be anchored to technical confluence around the $58.00 zone noted by the 38.2% Fibonacci retracement of the commodity’s trading range since February 2016 as well as the downward sloping 20- SMA and 50-SMA. Yet, the 200-SMA on the weekly chart approaching $55.00 and short-term uptrend developed since prices bottomed out in December 2018 could present positive tailwinds throughout 4Q-2019.
OIL VOLATILITY INDEX & CRUDE OIL PRICE CHART: DAILY TIME FRAME (DECEMBER 2018 TO SEPTEMBER 2019)
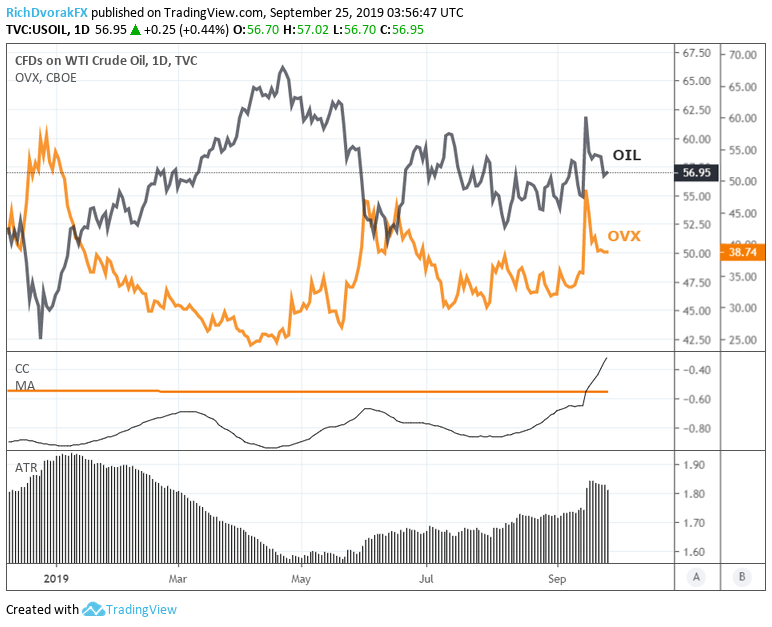
Chart created by @RichDvorakFX with TradingView
At the same time, the recent rise in oil volatility could keep a lid on bullish prospects for crude oil prices considering the general rule of thumb that there is a broad inverse relationship between implied volatility and an underlying asset.
DOWNLOAD THE COMPREHENSIVE DAILYFX Q4-2019 CRUDE OIL TECHNICAL FORECAST FOR FREE HERE
-- Written by Rich Dvorak, Junior Analyst for DailyFX.com
Connect with @RichDvorakFX on Twitter for real-time market insight


