


Gold Price Chart – XAU/USD Weekly
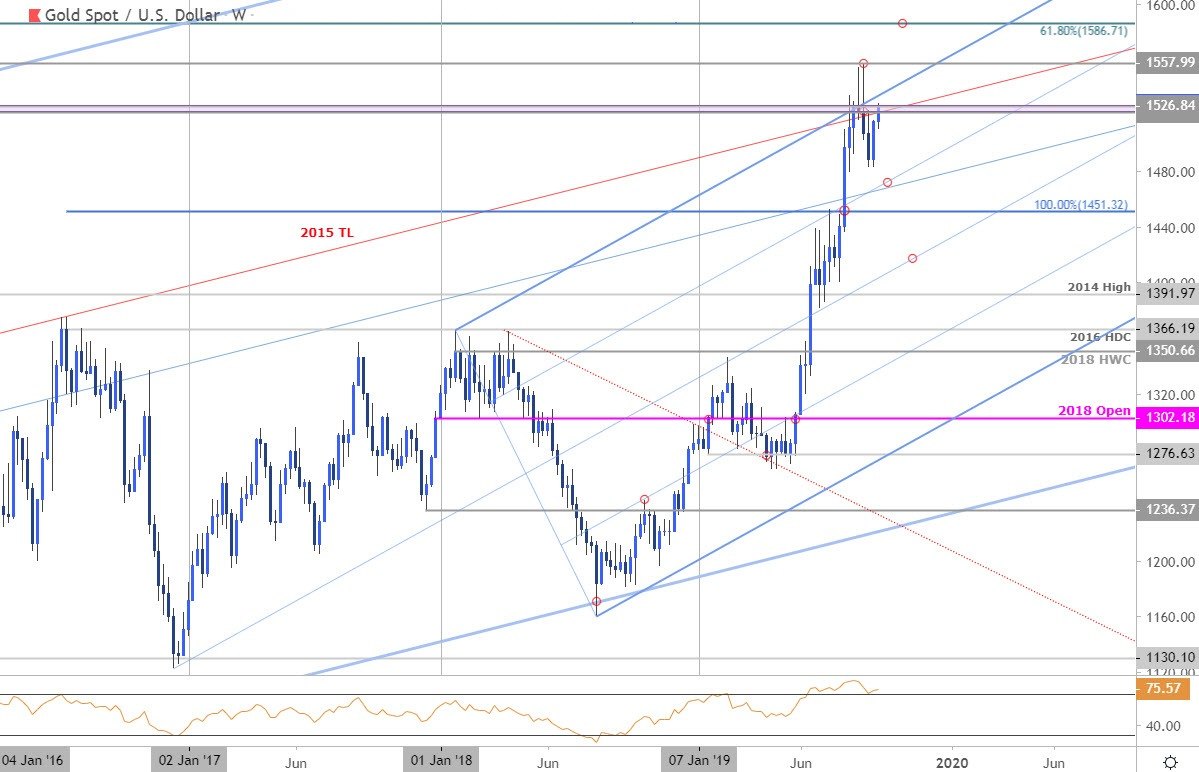
Chart created by Michael Boutros using TradingView
Gold has been on a tear with the precious metal rallying four of the past five months to fresh multi-year highs in September. The technical breakout has reached long-term trend resistance and threatens the broader advance heading into the close of the year. The immediate focus is on the 1522/26 pivot zone where the late-2011 & 2012 lows converge on the September open. The upper parallel of the ascending pitchfork we’ve been tracking off the 2016 / 2018 lows stands just higher – expect an accelerated rally IF price surpasses this threshold with such a scenario targeting 1558 and the 61.8% retracement of the decline off the record 2011 high at 1586.
Gold prices are up more than 19% since the start of the yearly and while the broader outlook remains constructive, seasonal tendencies do not favor gold in the fourth quarter and the advance is vulnerable heading into October. The levels are clear and while the bulls do seem in control, the advance will not be without interruptions and a larger washout in price may offer more favorable entries closer to trend support. Here are the levels that matter on the Gold technical charts heading into the final quarter of 2019.
--- Written by Michael Boutros, Technical Currency Strategist with DailyFX
Follow Michael on Twitter @MBForex
REAdy to put your new knowledge to work?


