CRUDE OIL PRICE FORECAST: TECHNICAL RESOLUTION SOUGHT AFTER BEFORE NEXT MAJOR MOVE
- Crude oil price action experienced a considerable amount of volatility recently that has potential to carry over into the final quarter of 2019 beginning next week
- The price of crude oil remains juxtaposed between compressing trendlines as the commodity continues to coil like a spring before a major sustained breakout
- Be sure to check out these Crude Oil Trading Tips and Strategies
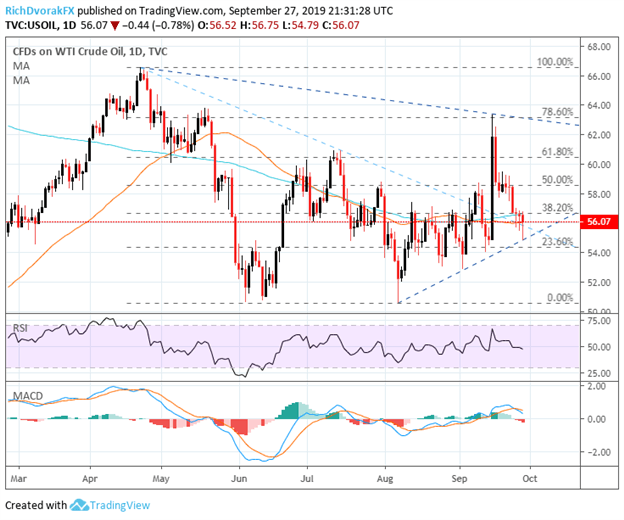
Crude oil continued to edge lower this past week from its recent surge earlier in the month owing to a drone attack on Saudi Arabia’s Aramco. That supply shock induced spike in the price of crude oil sent the commodity skyrocketing above prior trendline resistance extended from the April 23 and July 15 swing highs. That said, the lack of follow-through after breaching clear technical levels has occurred multiple times this year, and is a bit concerning when attempting to establish trend.
CRUDE OIL PRICE CHART: DAILY TIME FRAME (FEBRUARY 27, 2019 TO SEPTEMBER 27, 2019)

Chart created by @RichDvorakFX with TradingView
The short-lived jump in crude oil ran out of steam after kissing the 78.6% Fibonacci retracement level of its trading range since the commodity topped out earlier this year around $67.00. Recently, heavy selling pressure has driven the price of crude oil back to major technical confluence around a zone of $54.00-56.00, which is underpinned by the 23.6% and 38.2% Fibs of the previously mentioned trading range. This area is also highlighted by the 50-day and 200-day simple moving averages.
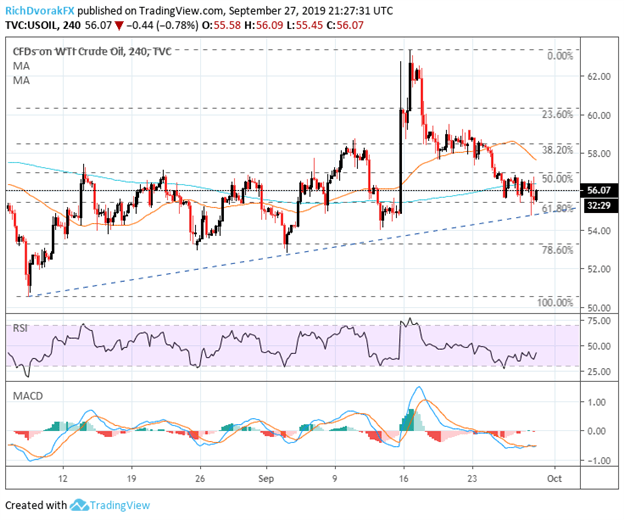
CRUDE OIL PRICE CHART: 4-HOUR TIME FRAME (AUGUST 06, 2019 TO SEPTEMBER 27, 2019)

Chart created by @RichDvorakFX with TradingView
Nevertheless, crude oil bulls will likely look to the bullish sloping trendline formed by the series of higher lows printed since the bottom set in August. A breach of rising support brings the August 26 and September 3 lows around $53.00 into focus, though the door could open for a retest of the August 7 swing low if this last line of defense fails to keep crude oil prices afloat.
That said, the RSI and MACD indicators shown above could be signaling fading selling pressure as the commodity bounces off confluent support at the $56.00 price level. Looking to the upside, the mid-point retracement of crude oil’s trading range since its August 7 low, in addition to the 50-SMA and 200-SMA, might keep a lid on upside progress. If this area can be topped, however, the 38.2% and 23.6% Fibs of crude oil’s recent bullish leg could serve as potential upside peaks before the September swing high comes into scope.
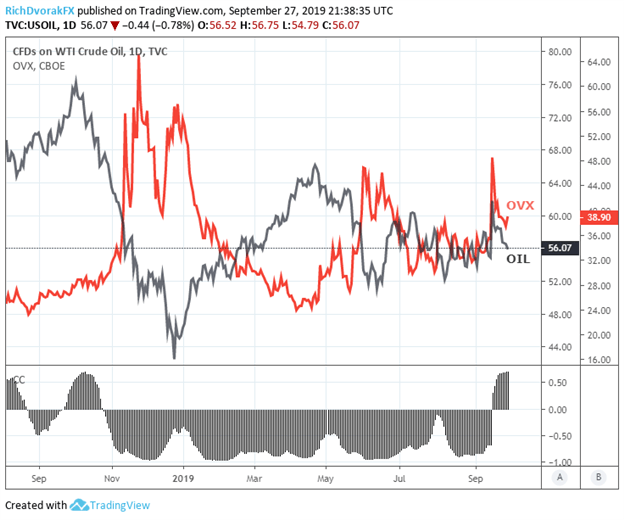
OIL VOLATILITY INDEX (OVX) & CRUDE OIL PRICE CHART: DAILY TIME FRAME (AUGUST 07, 2018 TO SEPTEMBER 27, 2019)

Chart created by @RichDvorakFX with TradingView
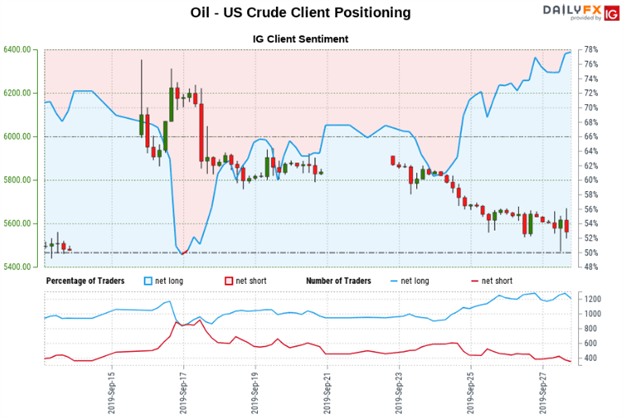
Expected oil price volatility – measured through the Cboe crude oil volatility index (OVX) – looks like it could be attempting to turn back higher. The typically inverse correlation between the two is presently positive, but it appears to be drifting back to its typical relationship. Alas, an uptick in volatility could bode ill for the commodity. Nevertheless, a glance at IG Client Sentiment data could provide traders with a unique look at the bearish and bullish change in biases among retail traders as crude oil price action progresses.
CRUDE OIL – IG CLIENT SENTIMENT INDEX PRICE CHART: 4-HOUR TIME FRAME (SEPTEMBER 13, 2019 TO SEPTEMBER 27, 2019)

Chart via IG Client Sentiment Report
-- Written by Rich Dvorak, Junior Analyst for DailyFX.com
Connect with @RichDvorakFX on Twitter for real-time market insight


