


Gold Prices Talking Points:
- Gold’s failed rally this past week signaled more than an inability to return to 6-year highs
- A ‘right shoulders’ has formed for a large H&S over these past two months, a reversal pattern
- Congestion threatens a turn but the prevailing trend is still broadly bullish
What are the most common trading mistakes? What are the traits of those who are successful navigating the market? Download our free Traits of Successful Traders trading guide.
Technical Forecast for Gold: Bullish
Gold is an important market for those watching the ‘big picture’ of the global macro landscape. In the precious metal, we find a safe haven of a very specific sort: it represents an alternative to traditional fiat or benchmark assets. The pace-setting climb the US equity indices have held onto with a manic grip through its 10th consecutive year has been dubbed ‘the most hated bull market in history’. That is owing to the remarkable consistency against the backdrop of exceptionally poor returns (yields, dividends, carry) and the laundry list of systemic risks that circle just outside the bulls’ sphere of complacency. It is this perspective of what role the commodity plays in the broader market that we should remember when we weigh the impact of the prevailing trend this past year against the provocative reversal pattern that has formed through these past two months congestion.
First, a consideration of the prevailing trend – a good place to establish our assessment of probabilities. We can determine this through trendlines, moving averages or a number of other technical means. The perspective of change over the past quarter and year shows very clearly that the bearing is bullish. We are well above the 200- and 100-day moving averages but it is the 50-day average which draws the most attention as is at the approximate close of Friday’s session. In contrast, while medium to long term bearings are still pointing higher, the past weeks and few months offer indecision. It is through this congestion that we see a head-and-shoulders (H&S) form. This is a favorite, traditional reversal pattern which holds in spades the most important and frequently overlooked trait: a strong prevailing trend to turn. The neckline aligns loosely with the 50-day moving average and more explicitly to the midpoint (50% Fib) of the 2011 all-time high to December 2015 range low around 1,480/85.
Chart of Gold (XAUUSD) with 50-Day Moving Average (Daily)
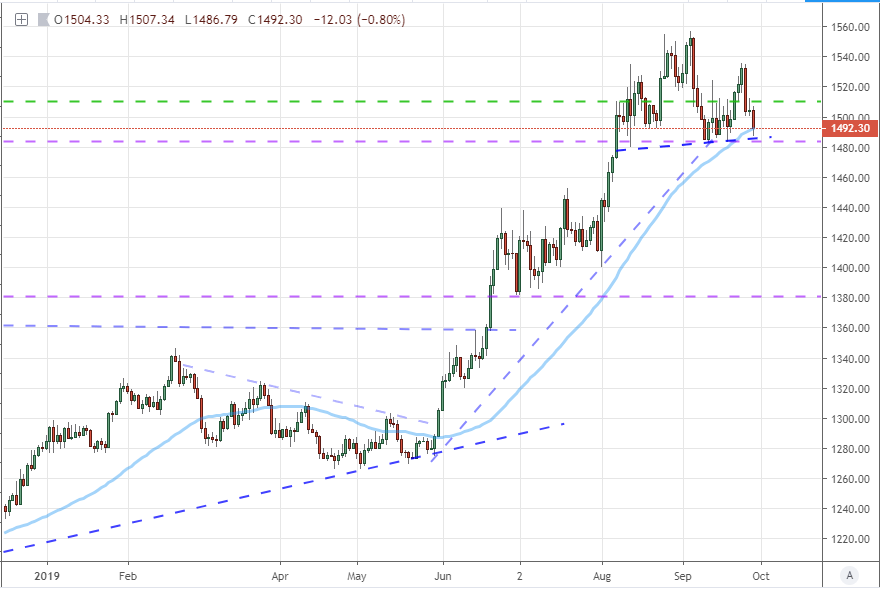
Chart created with the TradingView Charting Platform
Zooming in on the reversal pattern itself, we can see how distinct all the relevant levels are. There is a frequently tested support in the 1,485 level virtually every week back to the second week of August. When it comes to the potency of technicals, the wider the recognition of the level, pattern or indicator; the more potential it carries. If we drop this floor next week, there will certainly be a portion of the speculative rank that will take it as a signal of a more productive bearish shift. Yet, to truly turn the momentum of the past year will represent the first major Fib (38.2%) at 1,407 and a much larger former resistance in a multi-year congestion breakout down at 1,360. It would be easier to track back into the range of the past few months, but another deferment will only add to anticipation of an inevitable break.
Chart of Gold (4 Hour)

Chart created with the TradingView Charting Platform
One way to get a sense of the ‘pressure’ behind this market is to compare the level of congestion in recent price action relative to the degree of volatility that persists. The H&S pattern formed over the past 35/36 days so I set it to 35 for a round figure. The average true range (or ATR) gives an activity reading over this period that hold near highs seen back in March 2016. The range of movement though is exceptional contrast with the span as a percentage of spot price has dropped back to levels comparable to the March 2019 pre-breakout.
Chart of Gold with 35-Day Historical Range and ATR (Daily)
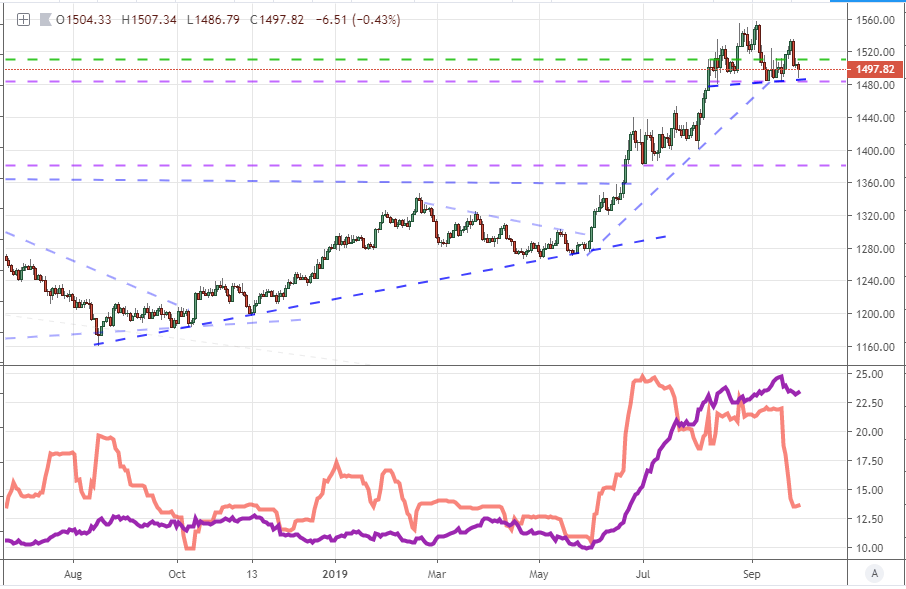
Chart created with the TradingView Charting Platform
When we eventually do see the break – whether false or committed, bullish or bearish – it is important to keep tabs of the critical milestones with these bearings. On a weekly chart of gold prices, we can see the scale of the range over the past 8 years as well the midpoint that currently lines up the floor of our present pattern. We can also see that this rally these past four months was itself a breakout from an exaggerated inverse H&S pattern. To the upside, we are near levels that acted as support for the fourth quarter of 2011 and all of 2012. Record highs are still a ways off in Dollar terms – though spread across other major currencies, we are much closer to all-time high commodity levels.
Chart of Gold - XAUUSD (Weekly)

Chart created with the TradingView Charting Platform
For a combo technical/fundamental chart, I am highlighting a unique relationship for this market relative to its underlying implied (expected) volatility levels. There is a unique positive correlation between spot and derivative which stands in direct contrast to the S&P 500 and VIX for example. That is owing to gold’s safe haven status, but it also signals what we should be looking for from the market in general. The more unstable or frightened global investors are, the more appeal the metal has. Keep tabs on volatility across the financial system.
Chart of Gold with CBOE’s Gold Volatility Index (Daily)
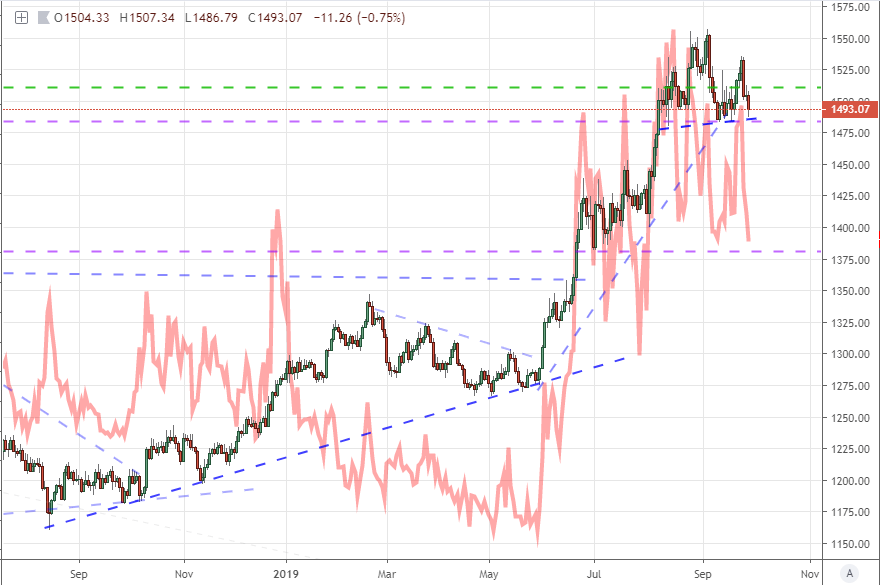
Chart created with the TradingView Charting Platform
Another important chart to familiarize yourself with is the positive correlation between gold and government bond prices, or the negative correlation they maintain to yields (the latter is below). When we price gold, there is more than just a safe haven appeal, its advance is also a direct move away from a benchmark currency like the Dollar – or other major currency we price it in. Yields tend to reflect the same growth, financial stability and monetary policy bloating that we see direct currencies in general without acting the role of the pricing instrument.
Chart of Gold – XAUUSD – and Aggregate 10yr Gov’t Yield for US, UK, GE, JP (Daily)
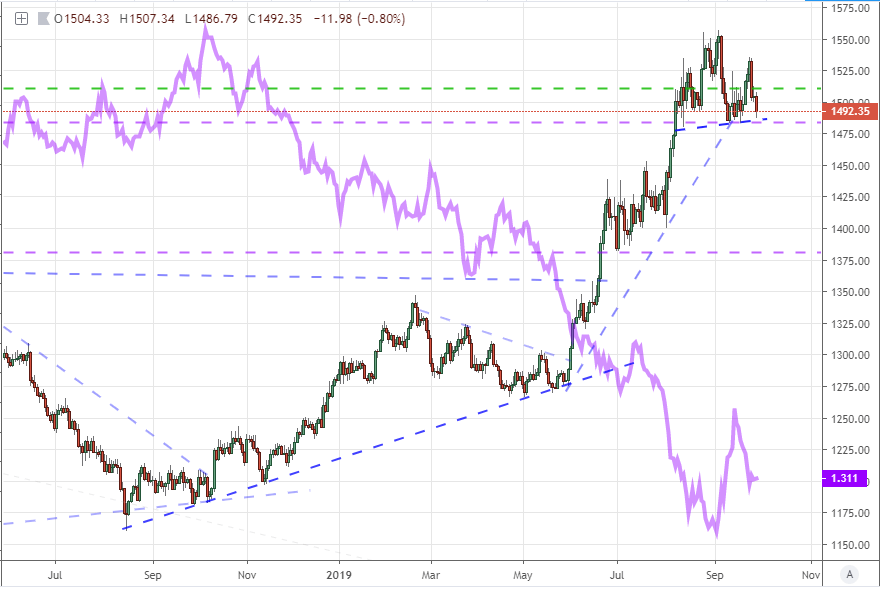
Chart created with the TradingView Charting Platform
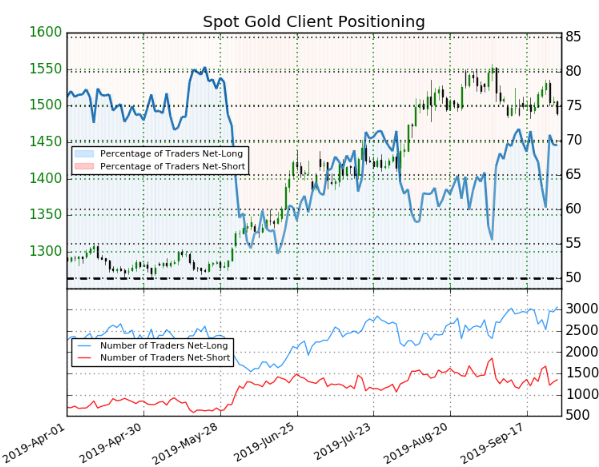
See how retail traders are positioned in Gold along with other key FX pairs, indices and oil on the DailyFX Sentiment page.
If you are looking at the speculative positioning aspects of the market, there are is a stretched bullish view from both the short and long-term speculative perspective. Whether we consider this a measure of momentum or contrarian reversal signal depends on the other context upon which we place our emphasis. The longer-term perspective of the net speculative futures traders (via COT) shows a near record long build up with this past four-month rally. From short-term retail traders measured via the IGCS, we are only the highest since the long congestion broke back in May. That said, independent long interest is the heaviest we have seen in a long time.
Chart of Net Speculative Positioning in Aggregate Dollar Futures from CFTC Report (Weekly)

Chart of Retail Trader Positioning from IG Clients (Daily)
.


