


Dollar Talking Points:
- The DXY Dollar Index overtook 98.35 Wednesday to trade at its highest level since May 2017
- A two-day selloff through Friday has raised risk of a false break reversal, expect volatility ahead
- See what we expect from Dollar, Euro and Pound along with key indices and commodities over the third quarter
Technical Forecast for Dollar: Bearish
The Dollar experienced a wild ride this past week. The first half of the five-day stretch saw the steady climb towards a three-month range high with data-driven acceleration through Wednesday earning the breakout traders have been awaiting. We would close out the month with that charge, leaving July the best performing monthly performance since November 2016 (the post-election rally). The combination of pace and technical achievement certainly ramps up the speculation that the bulls are wresting back control from an uncertain market.
However, overcoming the well-established inertia is not so easy. This has been the baseline for this currency for over a year: general chop with a subtle bullish drift. Turning this most recent run into a lasting drive will take considerable technical charge and no small amount of fundamental influence. The sharp reversal through Thursday and Friday this past week certainly puts a serious dent in the effort. When building momentum to overcome the gravity of a persistent range, it is best not to see the breakout cutdown immediately upon lift off. The pullback encourages traders to look more critically at how stretched the market has been over the preceding weeks of progress, how aberrant its behavior. It would be relatively ‘easy’ for the market to revert to its range and ‘difficult’ for to fight for a motivated trend.
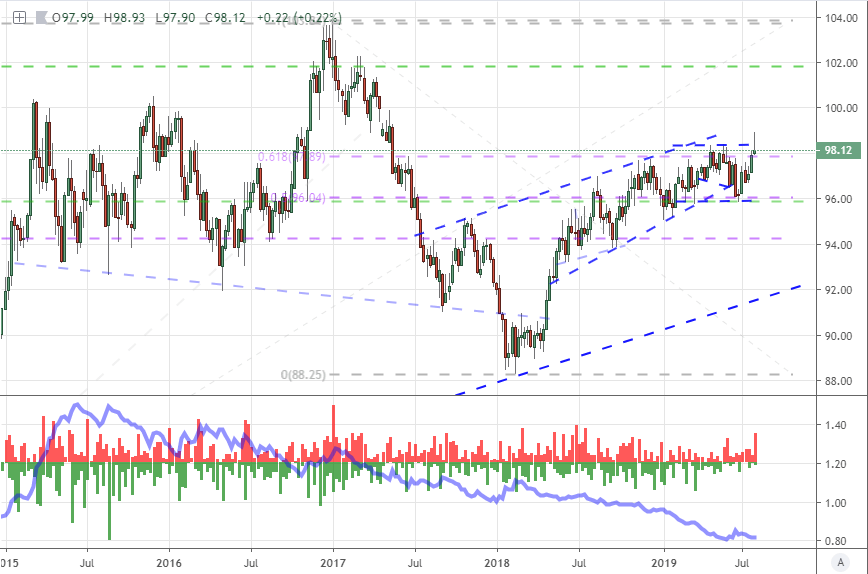
Chart of DXY Dollar Index with 200-Day and 20-Day Moving Average (Daily)

Chart created with the TradingView Charting Platform
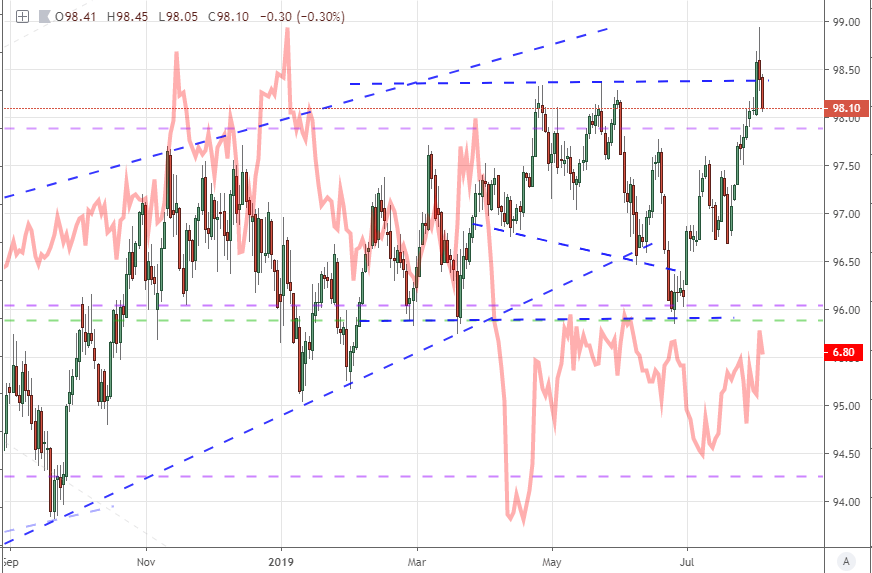
On a lower time frame chart – 8 hour below – the momentum of the past month and weight of the technical break is just as easy to register. The market was clearly observant of the 98.35 range top on the DXY Index (trade-weighted) until that wind of volatility blew into the market. It is important to recognize that this rally was centered on event risk (the FOMC rate decision) as it speaks to the lower potential of duration and can tell us what event risk to be more mindful of in the future – even technical traders need to respect the economic docket. The dedicated pullback on the other hand was persistent and measured which suggests it is more indicative of the norm. With momentum measures hitting extremes (like the RSI), a pullback seemed to have no problem with diminishing what would otherwise be an impressive breakout.
Chart of DXY Dollar Index with 200-Bar Moving Average and RSI (8 Hour)

The full scope of the market’s restraint is better observed on higher time frame charts of Dollar activity. The monthly chart (not shown) may offer the best bullish performance since in nearly three years, but it doesn’t actually offer the kind of transition that confidently inspires trend. The weekly chart reflects on that same failure to evolve. The ‘tail’ left on the past week’s candle looks more like the failed breakout and the context of it representing the biggest reversal on this time frame in 12 months suggests the effort was snuffed out quickly. Meanwhile, the activity level behind this market continues to collapse with the 12-week average true range (a basic, priced-based measure of volatility continues to dither at five year lows.
Chart of DXY Dollar Index with ‘Tails’ and 20-Week ATR (Weekly)
If we are to better assess the technical potency of the Greenback through the week ahead, it is worth noting that there is an incredibly disparate view of its performance across various pairings. Deemphasizing the EURUSD that is the core of DXY, an equally-weighted Dollar index shows a far more aggressive two-week rally – up as much as 2.9 percent – and adherence to the same general range high. This reads more like a stall at the critical technical boundary that could set up range reversal. Now, this is not a chart that most will work from as it is a synthetic of 7 ‘majors’, but the underlying performance exists nonetheless.
Chart of Equally-Weighted Dollar Index with ‘Tails’ and 20-Day ROC (Daily)
Putting some key fundamental undercurrent to charts, it is important to keep track of a few opposing forces that are vying for the Dollar’s attention. The initial charge for the Dollar this past Wednesday was the FOMC rate decision. The US central bank actually cut rates 25 basis points which seems to contradict the simplistic textbook explanation that rate cuts equals current depreciation, but the market was instead impressed that the Fed was not committing to a steady slide in returns. Of course, the escalation on trade wars through the end of this past week lowers ramps up speculation of a recourse for more cuts.
Chart of DXY Dollar Index and Implied Fed Funds Yield December (Daily)

Another role that armchair fundamental observers will expect the Dollar to resort to in the week ahead is its role as a safe haven. The world’s most liquid currency certainly holds a place in the rank for security when financial stability truly starts to breakdown, but moderate levels of risk aversion are not likely to send the Dollar flying higher. Below, the correlation between the DXY and the aggregate of EURUSD, GBPUSD and USDJPY implied volatility readings from the CME (‘FX Volatility’) is generally positive, but I wouldn’t expect the positive alignment to upgrade the currency to true bullish trend unless the shock is severe.
Chart of DXY Dollar Index and ‘FX’ Volatility Index (Daily)
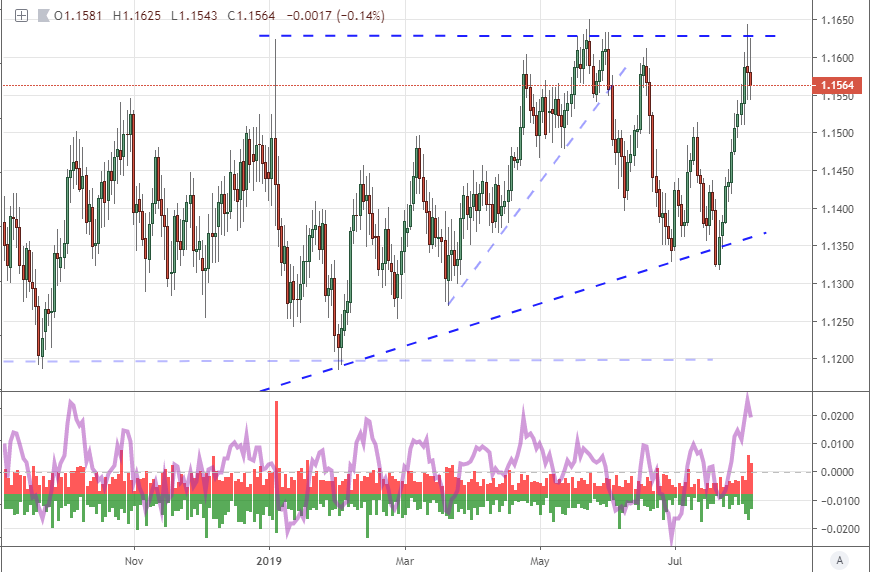
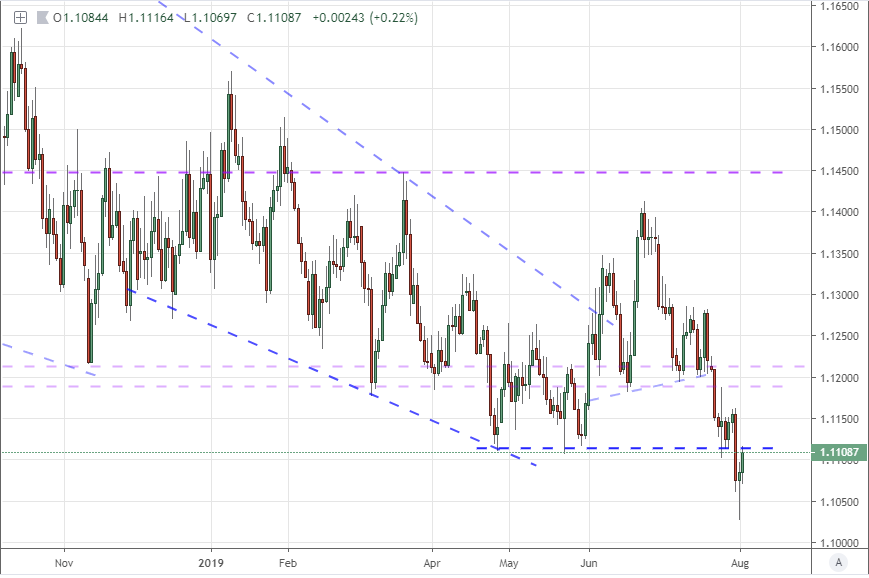
Taking a look across the more frequently traded majors, it is important to start with EURUSD. The most heavily traded Dollar pair, there was clear break in favor of the USD with the drop below 1.1115. Where DXY was reversed back within its three-month range, this baseline pair is still holding just below range support. While somewhat provocative as it seems to suggest former support can still stand as new resistance, the general restraint in market conviction and pace still makes this a technical pattern that will be difficult to live up to on meaningful follow through.
Chart of EURUSD (Daily)
In a somewhat different picture of Dollar performance, AUDUSD hasn’t readily participated in the end-of-week reversal that closed down momentum. In fact, this pair is all momentum as it earned an incredible 11 consecutive trading days of descent. That is the longest, unbroken bearish stretch on record and finds the market trading in an area last explored – I am not counting the January flash crash – back in early 2009. This is definitely a statistical anomaly that will revert to a mean, but I would be careful about assuming a fast reversal with the same momentum as the move down.
Chart of AUDUSD and Consecutive Candle Count (Daily)

And proving just how different the range of Dollar performance really is, USDJPY offered very little lift in favor of the US currency through the preceding two weeks and the retreat through the second half of the past week was acutely amplified. The two-day plunge through Friday was the biggest drop in a 48 hour stretch since May 2017. It pushed the market to trade at lows last seen in April of last year. And, before we gain too much confidence in a bearish clearance that can leverage more than just a range reversal in other Dollar pairs, that trendline landing around 106 at present is pulled from multiple high-visibility reversal lows stretching back to February 2013. It would be no small effort to break that floor. And, again, it is still difficult for this market to establish trends. Watch this pair closely.
Chart of USDJPY (Daily)

Looking to speculative positioning, we find the retail and futures crowd in rare unity leaning against the Greenback’s tenuous climb. This is interesting because the principal difference between these groups – aside from scale and experience as the futures group is usually akin to hedge funds – is time frame. Retail interests usually run much shorter duration, looking for tentative corrections while the futures group rides out significantly larger moves that can take months to form or play out. That suggests that the market is pushing back against the bullish picture here and now.
See how retail traders are positioned on EURUSD, USDJPY, GBPUSD and other key Dollar crosses on the DailyFX Sentiment page.
Chart of Net Speculative Positioning in Aggregate Dollar Futures from CFTC Report (Weekly)

Chart of Retail Trader Positioning from IG Clients (Daily)


