


Equity Indices Technical Outlook:
- S&P 500 pulling hard off top-side resistance line
- DAX breached December 2019 trend-line
- FTSE 100 wrecked bull-flag breakout
For the intermediate-term fundamental and technical outlook, check out the Q3 Equity Forecast.
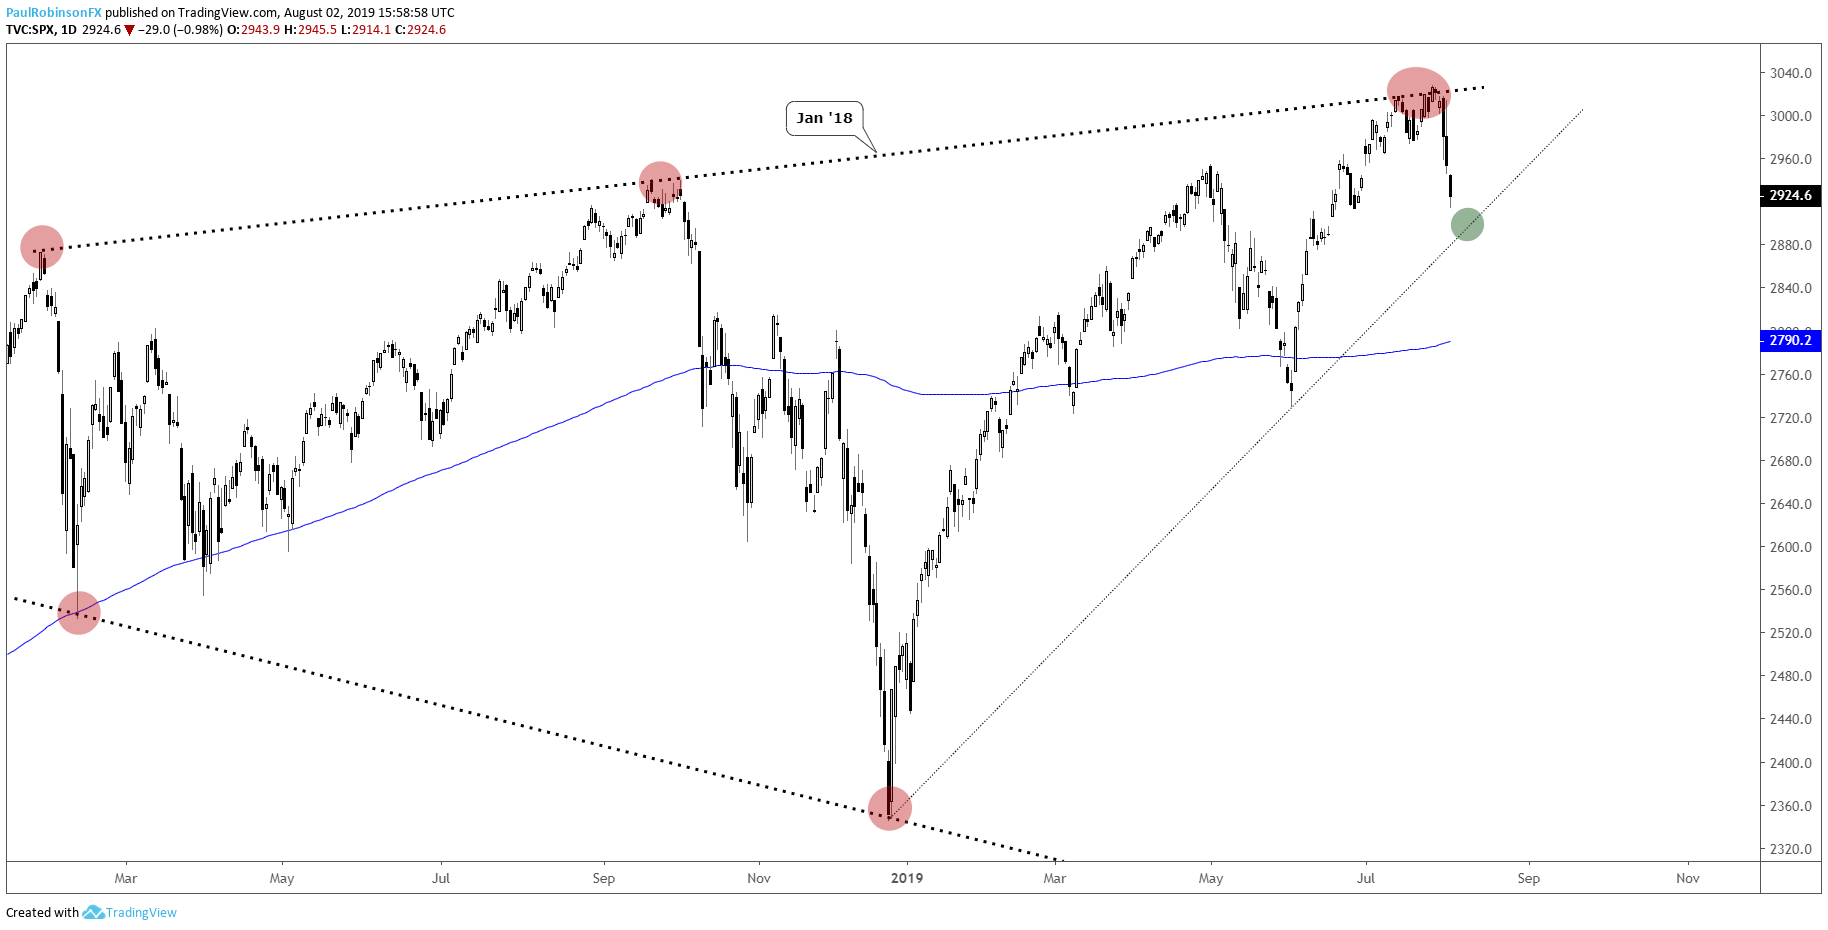
S&P 500 pulling hard off top-side resistance line
The S&P 500 was bumping its head up against the top-side trend-line running over from January 2018, a trend-line that also makes up the upper portion of a large, potentially very bearish topping pattern. With that in mind, the turn down was not totally out of the blue.
As we head into next week the market is already becoming a bit downside extended in the short-term, but still not yet at support levels warranting a bounce. The trend-line from December could get tested early next week and may provide a lift. How that lift plays out will be critical as downward momentum currently suggests we could see an extended slide, perhaps down to the 200-day in the not-too-distant future.
Check out the IG Client Sentiment page to find out how changes in positioning in major markets could signal the next price move.
S&P 500 Daily Chart (Dec 2018 t-line)
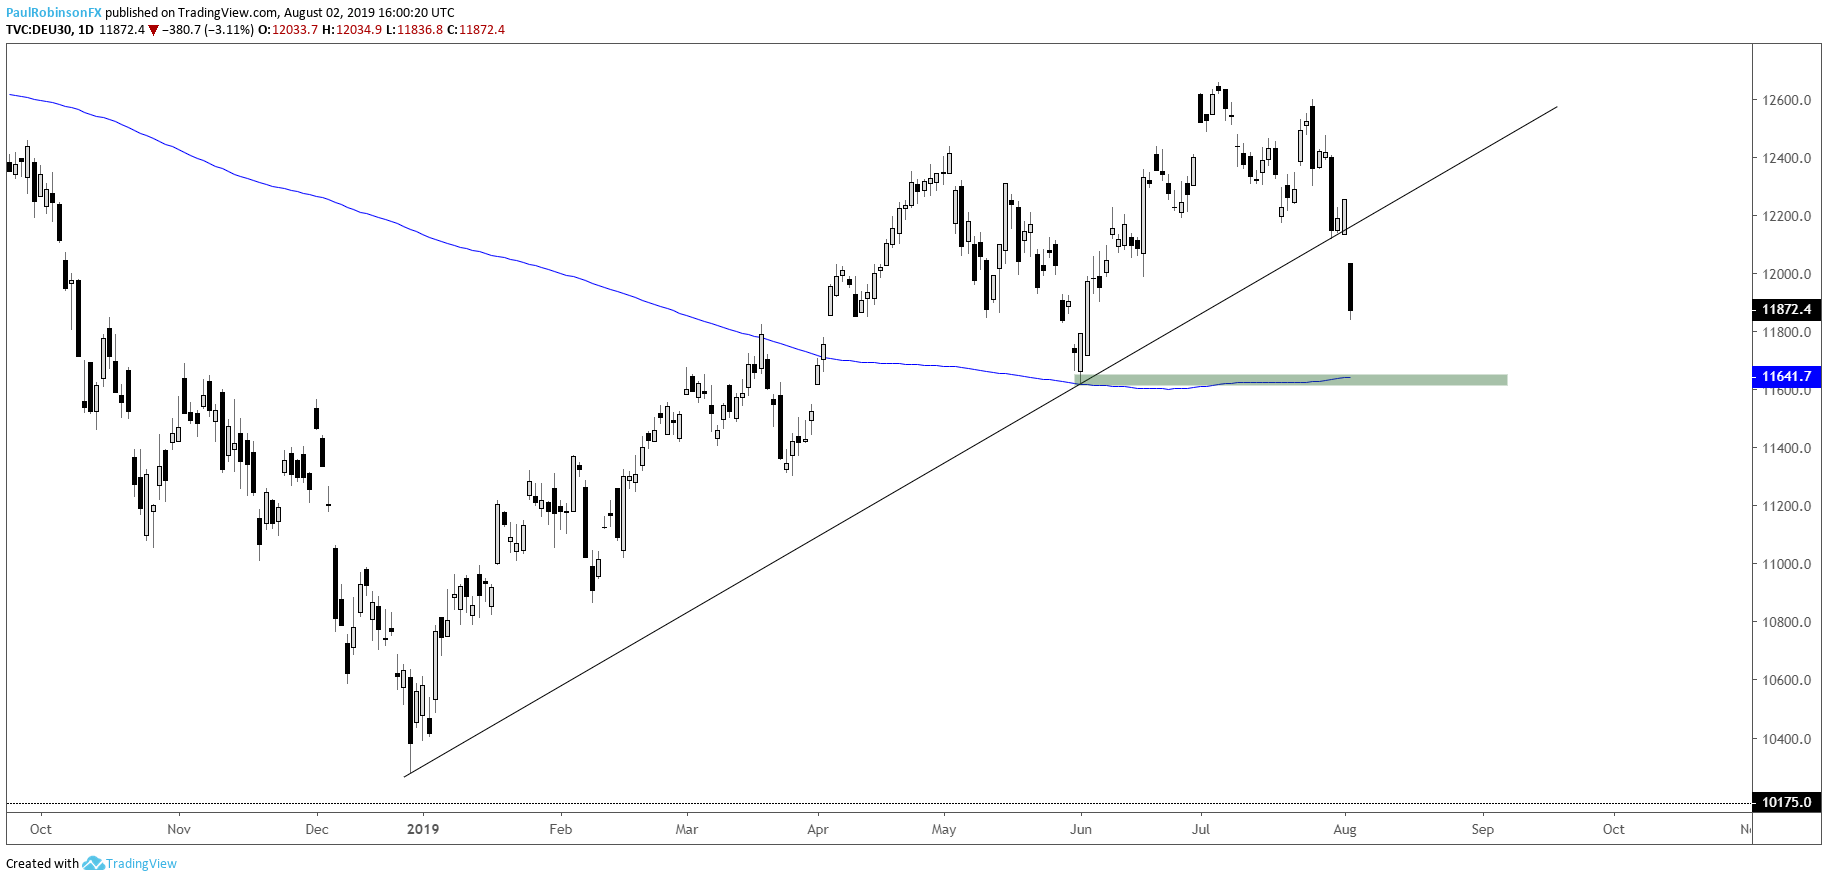
DAX breached December 2018 trend-line
The DAX failed the December 2018 trend-line on Friday with a gap in sympathy with the prior day’s afternoon session in the U.S. market. This puts in focus the 200-day around 11641 along with the low from June at 11620. This confluence could make for a good spot to see dip-buyers step in and at least induce a bounce.
DAX Daily Chart (below 2018 t-line)
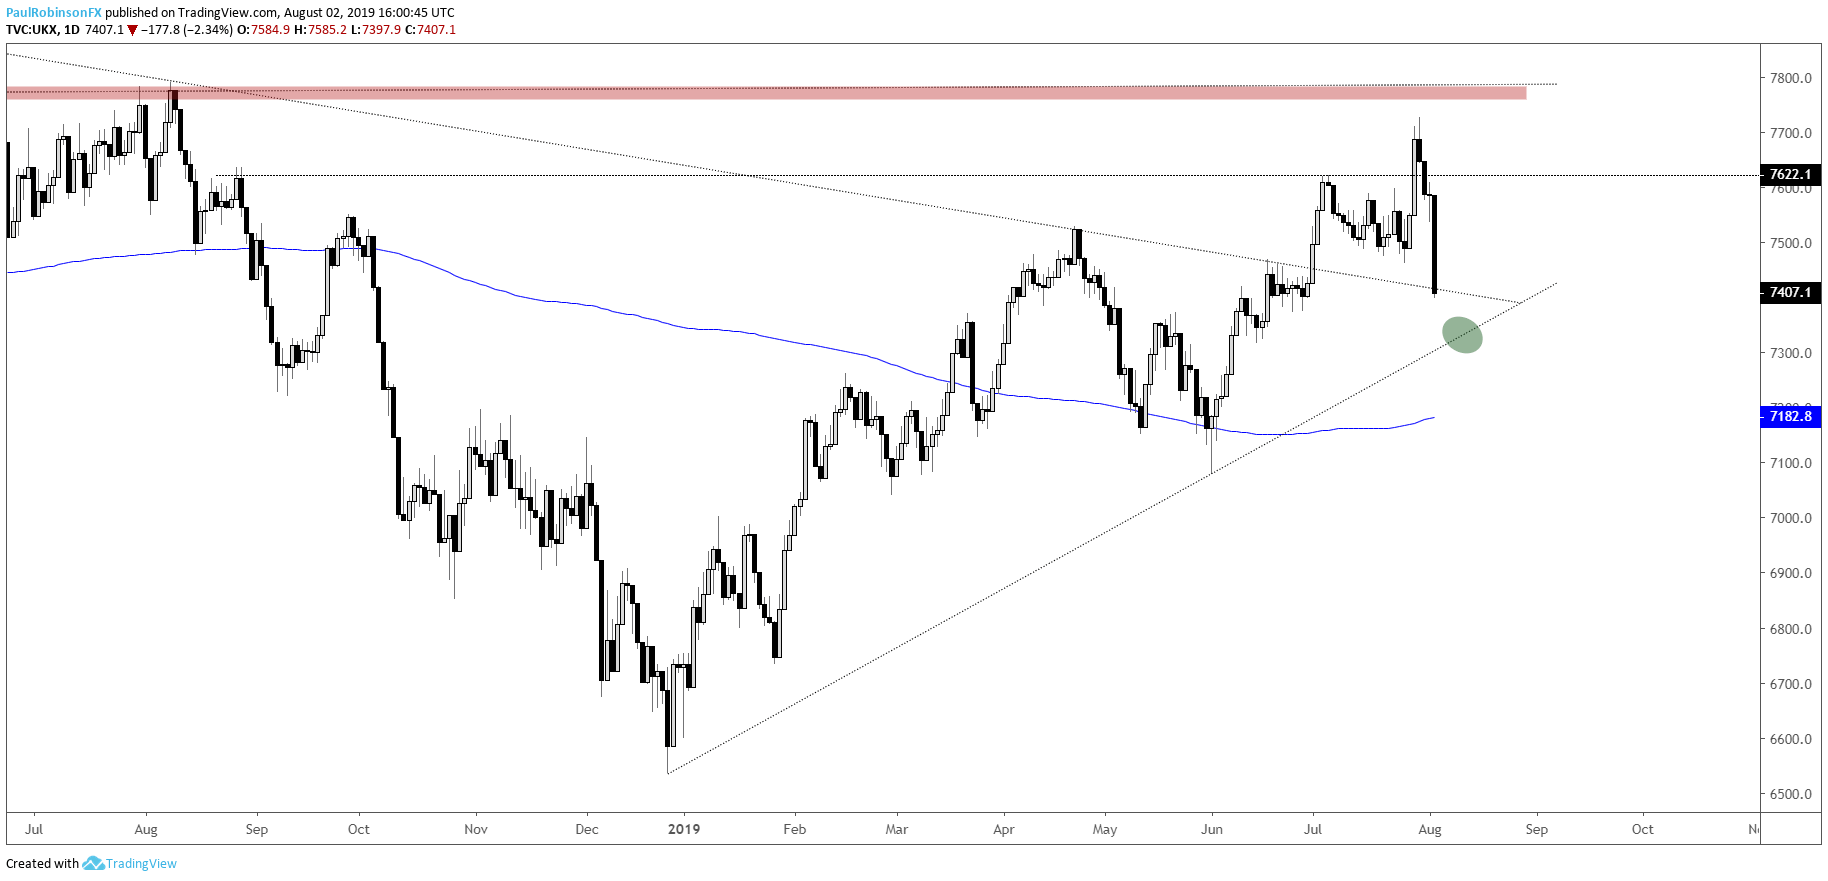
FTSE 100 wrecked bull-flag breakout
The FTSE broke out of a bull-flag on Monday, but quickly reversed the breakout and then some. Strong pressure is coming down on trend-lines from the 2018 high and low. It was a damaging week, but just as is the case with the other indices there is room for a bounce soon if support can hold. Will be on the watch for a bullish response off trend support and whether one can hold if it develops.
FTSE 100 Daily Chart (watch t-lines below)
Helpful Resources for Forex Traders
Whether you are a new or experienced trader, we have several resources available to help you; indicator for tracking trader sentiment, quarterly trading forecasts, analytical and educational webinars held daily, trading guides to help you improve trading performance, and one specifically for those who are new to forex.
---Written by Paul Robinson, Market Analyst
You can follow Paul on Twitter at @PaulRobinsonFX


